Over the last few decades, the importance of Japan to global asset allocators has diminished. Indexing their Japanese allocation, or indeed ignoring the asset class altogether since the turn of the century, would not have had a materially negative impact on performance. Certainly, the narratives surrounding the structural problems faced by the Japanese economy, particularly with regard to the country’s aging demographics, present a challenge.
Perhaps surprisingly, Japan’s equity market performance has been on a par with that of other major markets, such as Europe, since the global financial crisis (GFC) and even outperformed other markets since Prime Minister Shinzō Abe assumed office in late 2012. This prompts analysis of how Japan has kept pace, despite the perception that growth has been lacklustre (Exhibit 1). It is also timely to ask how the Prime Minister’s recent resignation will affect the positive momentum witnessed in Japan over the recent decade.
Exhibit 1: Japanese equity price performance relative to other major indexes since 2012
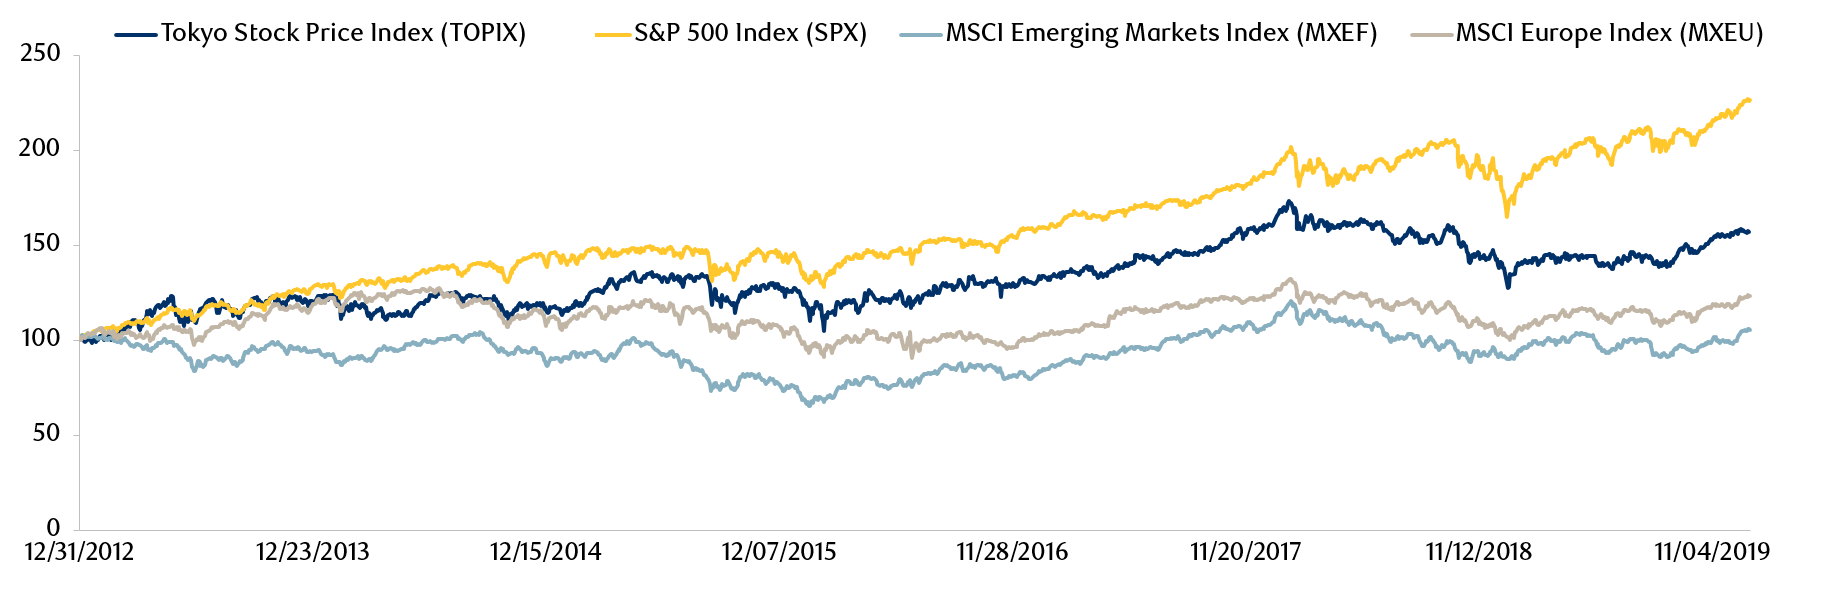
Source: Bloomberg. All returns based on USD. Data as at December, 2019.
We believe the answer to that question lies in understanding the fundamental shift in the Japanese economy, exemplified by changes to companies’ business models since the GFC. In this article we will attempt to ascertain where corporate Japan stands in its economic lifecycle. We will explore the dynamics behind the history of the last five decades to understand the investment opportunity at hand. It is our view that there are long-term and significant changes currently taking place in Japan, both in terms of the corporate world and in society. This should encourage those asset allocators who have ignored Japan to invest in this quiet revolution by further allocating to active managers in a market that we see as fertile ground for long-term stock pickers.
Where is corporate Japan today in its economic lifecycle?
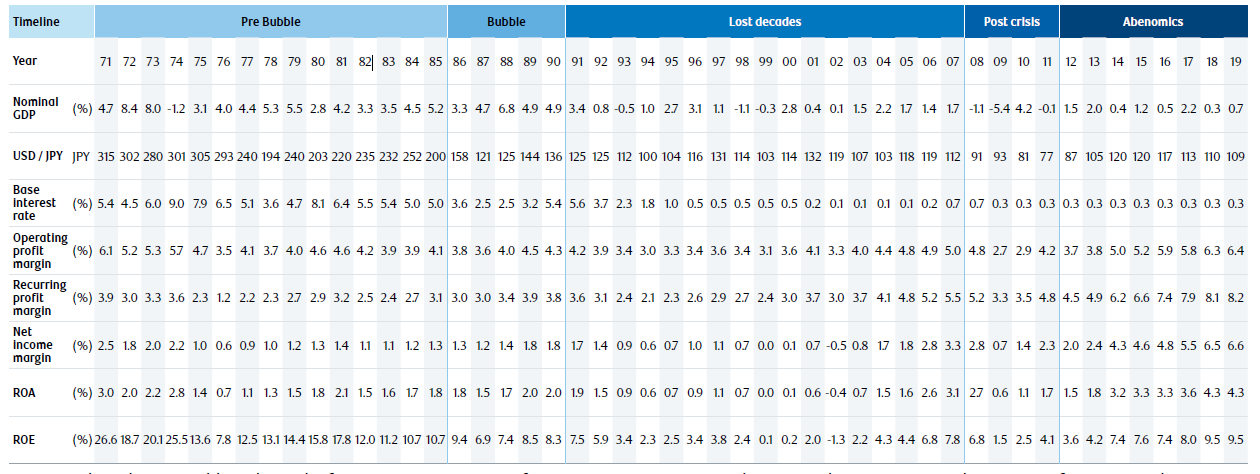
A study of Japan’s economic history illustrates the degree of evolution that companies, and society as a whole, have experienced and provides context to understand what may drive corporate earnings for the next decade. Exhibit 2 shows historical equity market performance which includes macro indicators such as GDP, exchange rates, interest rates, and fundamental indicators for companies such as profit margins and returns on assets and equity (Exhibit 2 and Appendix).1
Exhibit 2: Japan’s equity history and underlying macro/fundamental variables
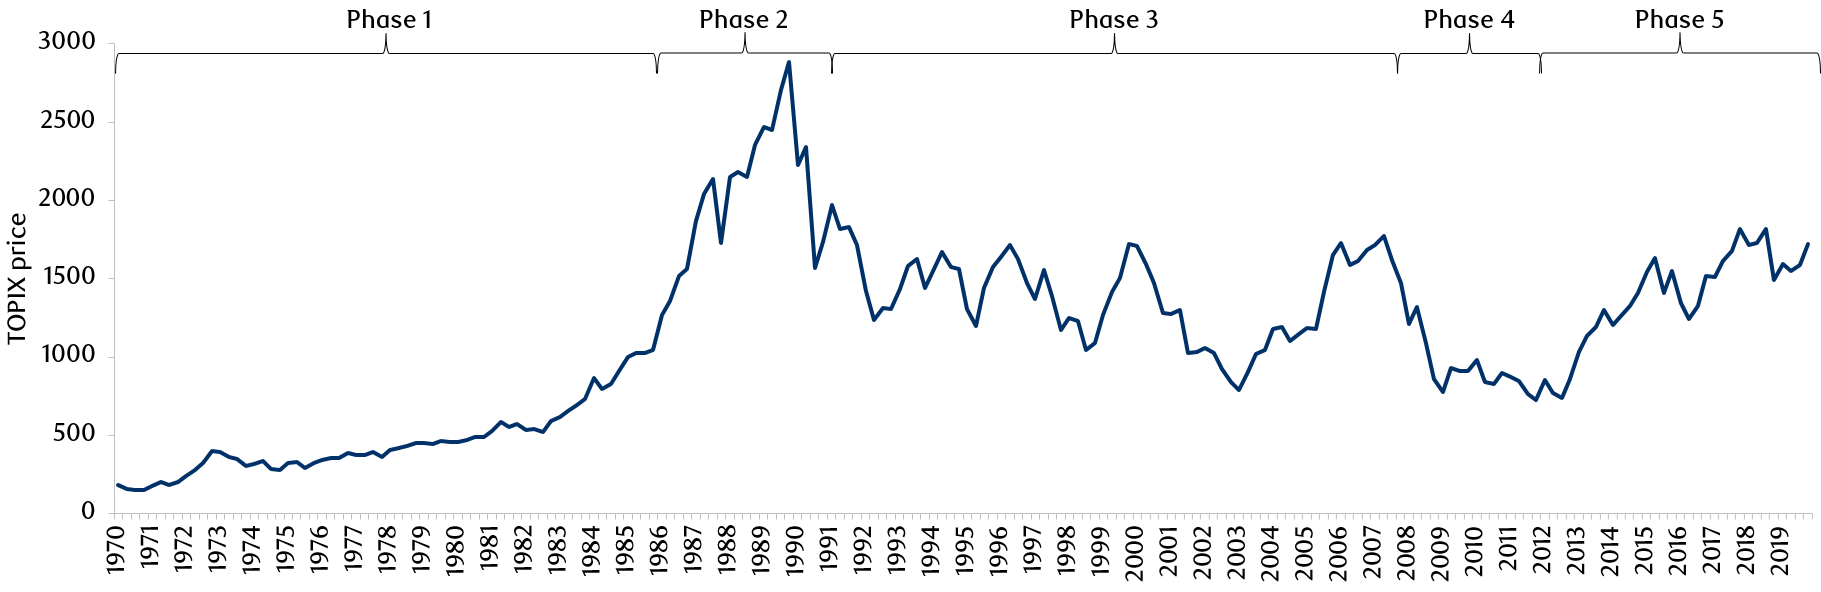
Source: Bloomberg, World Bank, Bank of Japan, Japan Ministry of Finance. Data as at December, 2019. Please see Appendix Section 1 for macro indicator data.
Phase 1 (1970-1986): the Japanese economy was booming, with the country growing into a global manufacturing powerhouse with exports the primary economic growth driver. While the Bank of Japan lowered rates to offset appreciation in the Japanese yen during the last few years of this phase, asset prices still remained under control. The period ended with the Plaza Accord of 1985 and the subsequent strengthening of the yen against the U.S. dollar: from 250 to 150 yen.2
Phase 2 (early 1986-1991): equity market performance began to diverge significantly from the underlying performance of the economy. The government cut base rates in response to an economic downturn triggered by sharp currency appreciation. Despite lagging earnings, equities continued to perform strongly. The quality of earnings growth in this period was questionable, however, and creative practices around accounting and valuation metrics were prevalent.
Phase 3 (1991-2008): commonly referred to as the “Lost Decades” when Japan went from a speculative bubble to a stock market crash and debt crisis. Corporate Japan as a whole was pre-occupied with recovering from the market crash and achieved no meaningful growth during this time; the economy also experienced an unprecedented and sustained period of deflation.
Phase 4 (2008-2012): corporate Japan began to change as innovation was born out of necessity. The GFC was followed by a much stronger yen which moved from 123 yen to the U.S. dollar to a high of 76 yen. This resulted in the collapse of corporate earnings dependent on exports and pushed companies to reassess their business models. Painstaking efforts were made to improve the cost structure, and localization of production in key markets was pursued instead of the previous model of manufacturing in Japan and exporting abroad.
Phase 5 (2012 – to date): Japanese Prime Minister Shinzō Abe was elected and introduced a combination of economic policies targeted to encourage private investment and structural reforms, more commonly referred to as Abenomics. From an equity investor’s point of view, Abe’s economic policies contributed to creating or reinforcing sustainable growth for the market.
With Abe’s resignation, political uncertainty may be a near-term negative but policy direction is unlikely to shift dramatically and the Liberal Democrat Party (LDP) is expected to maintain its pro-economy and pro-growth stance. More importantly, Japan’s transformation is not a recent invention of Prime Minister Abe or the LDP, but rather it is a bottom-up shift initiated by business over a decade ago. The Abe administration proactively supported the market by helping businesses to overcome inherent challenges, but business leaders had been redefining their strategic direction and business models well before Abenomics. Thanks to Prime Minister Abe, however, reform and easing really started to make an impact and the agenda to transform Japan’s economy became a shared goal for the entire nation. There has already been tangible progress in areas such as the corporate governance framework and there has been renewed interest from global investors; what has been set in motion should continue to move forward, unswayed by politics. It is a revolution of substance that is still, in our view, in full swing.
How is corporate Japan transforming itself?
Demographics play a key role in economic growth. The case for investing in emerging markets, for example, generally relies on demographics and urbanization to drive growth. In Japan, the shrinking and aging population has been a structural headwind and, when coupled with the post-bubble economic malaise, it has caused many global investors to ignore Japanese equity as an asset class (Exhibit 3).
Exhibit 3: Japan: population, history and outlook, 1970-2050
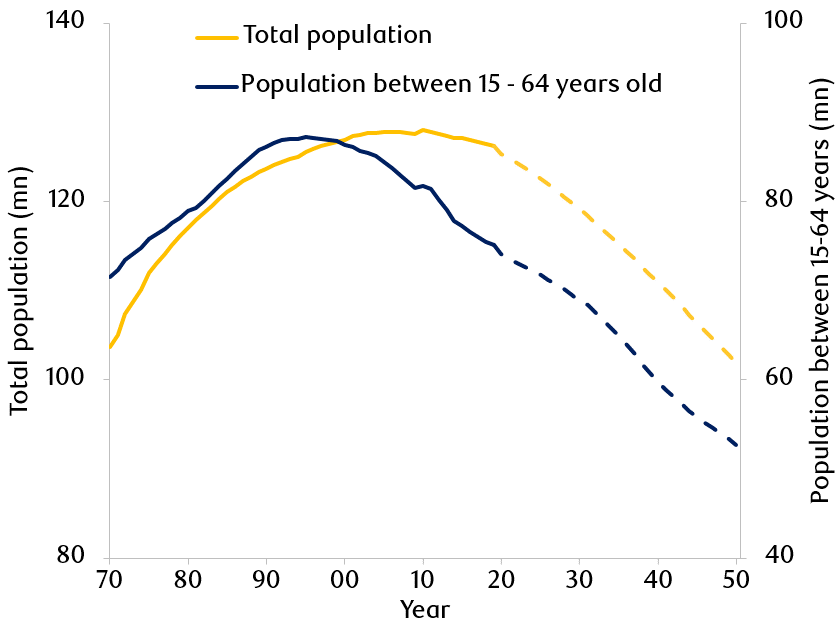
Source: Statistic Bureau of Japan, Japan National Institute of Population and Social Security Research. 2020 onwards estimated by the National Institute of Population and Social Security Research. Data as at December, 2019.
For Japanese companies, however, the negative effect of the country’s demographics is not new, as the workforce peaked more than a decade ago. Companies have been motivated, and to an extent forced, to shift their efforts to increase revenue from abroad. In the past 10 years, revenue contribution from overseas has grown from approximately 40% to around 60%, and the ability to grow a business abroad has become vital for a company’s survival.3 Companies have therefore rushed to relocate their manufacturing capabilities and to reduce currency exposure. In a sense, they began to act more like western multinationals, modifying business models to become ‘local production for local consumption’. It is interesting to note that foreign sales already far exceed nominal exports, and lead the growth in profits that Japan earns from its overseas operations (Exhibit 4).
Exhibit 4: Foreign sales are increasingly a greater determinant for corporate Japan
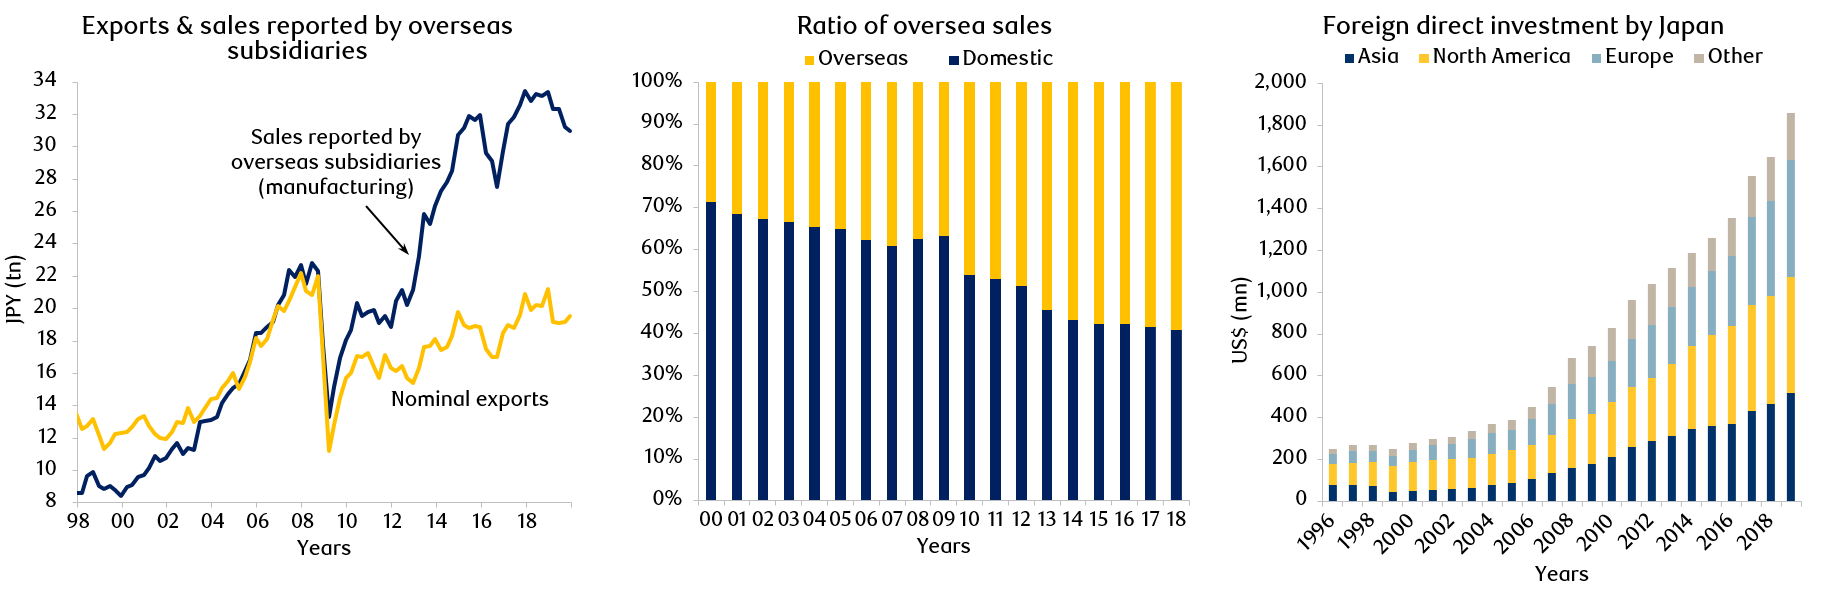
Source: Mitsubishi UFJ Morgan Stanley Securities (MUMSS), from Ministry of Economic Trade and Industry and Ministry of Finance materials. Note: based on quarterly figures. Data as at June, 2020. UBS, JETRO World Report. Data as at December, 2018. JETRO FDI Stock. Data as at December, 2019.
Domestic market dynamics have also been changing. In the absence of industrial growth locally, the degree of price competition is decreasing and market consolidation is picking up.4 As companies expand their businesses abroad in order to drive growth, they are also working to improve cost structures for their domestic operations. Many older small and medium sized enterprises are choosing to close or sell their businesses as they face the inevitable generational handover in ownership, and this is also helping market consolidation. As a whole, these changes in the domestic business landscape are driving up corporate profitability in Japan; profit margins have shown significant improvement following the GFC, in both manufacturing and non-manufacturing industries (Exhibit 5).
Exhibit 5: Domestic markets are becoming more profitable
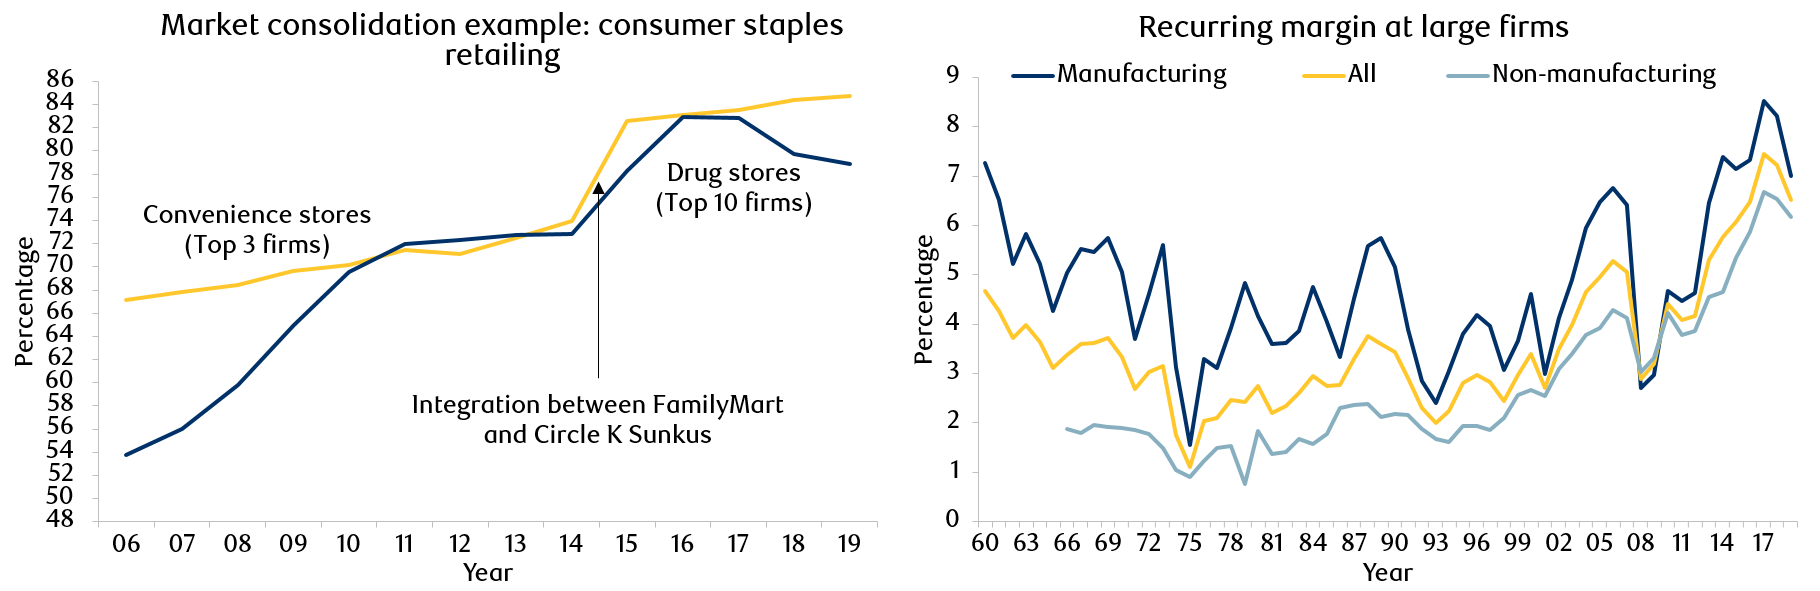
Source: Mitsubishi UFJ Financial Group (MUFJ), from Ministry of Economic Trade and Industry, Home Center Institute, and company data. Note: sales of the top three convenience store chains based on parent sales; the top ten drugstore operators differ by fiscal year. Data as at December, 2019. MUFJ, from BoJ Tankan. Note: NP margin figures through 1965, RP margin thereafter; FY2018 figure based on Dec-survey. Data as at December, 2019.
How has Abenomics been a major catalyst for the market?
Since 2012, Abenomics policies have focused on long-term structural reform, monetary easing and fiscal stimulus. Together with growth initiatives from the private sector, these policies provided the means to transform Japan’s economy and equity market. (Exhibit 6).
Exhibit 6: Macro indicators since Abenomics
Source: Bloomberg, Japan Cabinet Office, Statistic Bureau of Japan. Tokyo Stock Price Index (TOPIX) and MSCI Japan Index (MXJP). Data as at December, 2019.
Aggressive monetary easing from the Bank of Japan contributed to a weakening of the Japanese yen against the U.S. dollar, stabilising exchange rates at 100-110 yen, a level most exporters find to be manageable. A progressive deregulation of visa rules for Chinese and Association of Southeast Asian Nations tourists gave a tangible boost to domestic consumption, creating an inbound tourism boom. The focus on creating a virtuous cycle by raising the rate of labour force participation and increasing the potential growth rate even challenged Japan’s long-held socio-cultural norms in unforeseen ways. For example, Abenomics explicitly promised to boost female labour participation rates, and in 2018 the House of Representatives (Japan’s lower house) passed a law to introduce new visa regulations to allow more foreign workers into the country (Exhibit 7).
Exhibit 7: The demographic landscape is changing for consumers and the workforce
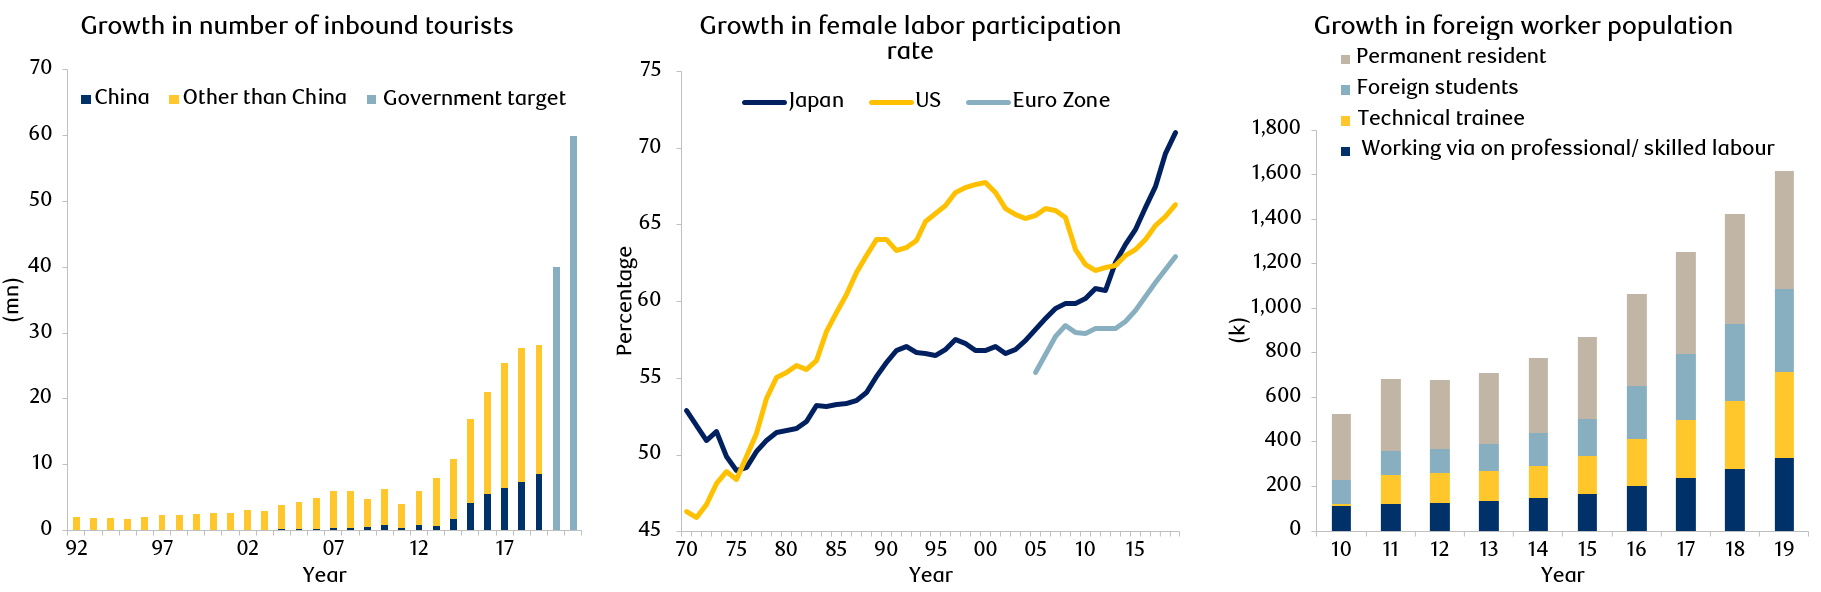
Source: Japan National Tourism Organization, data as at December, 2019. OECD, data as at December, 2019. Japan Ministry of Justice, data as at December, 2019. Note: 2020 and 2030 are estimated by Ministry of Land, Infrastructure, Transport and Tourism.
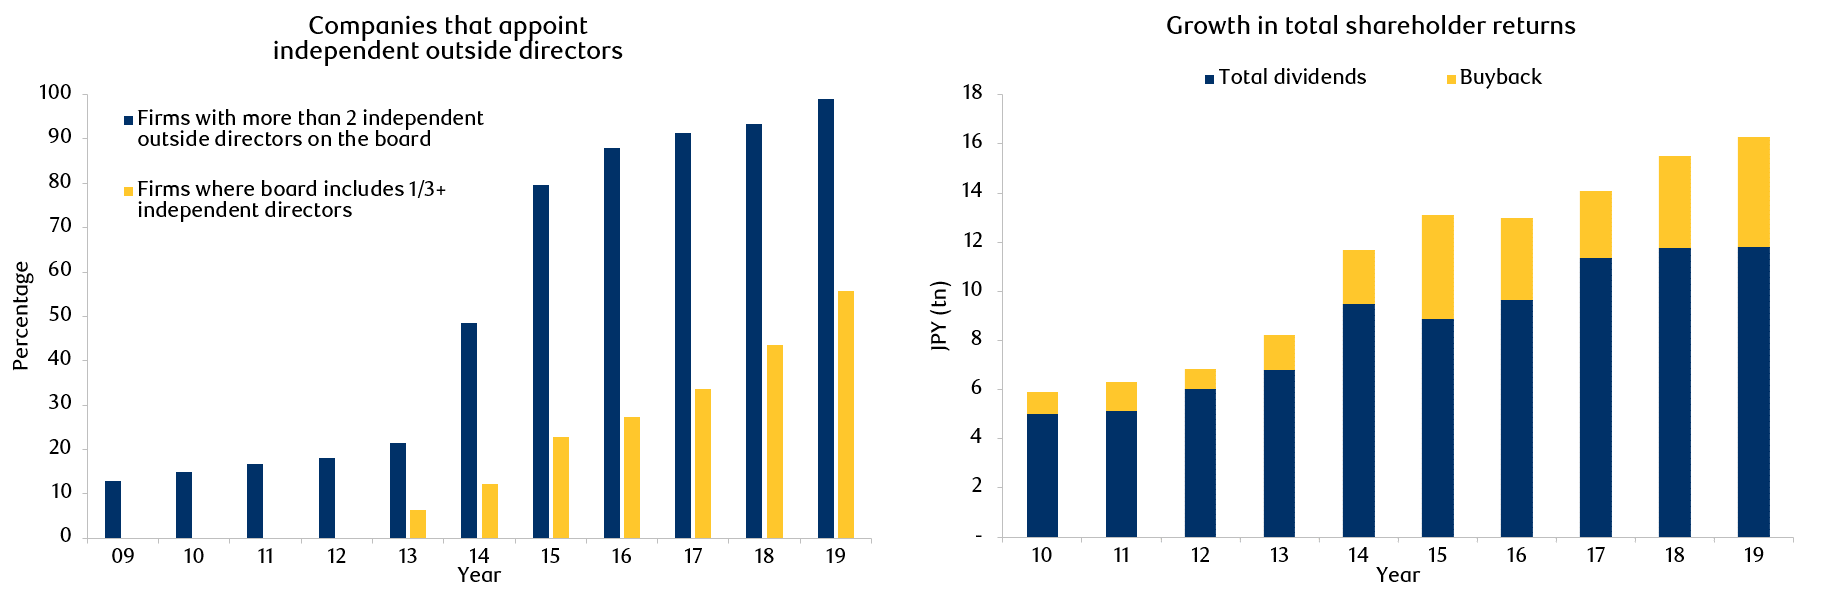
Moreover, Abenomics not only focused on improving the fundamentals of the economy, but also worked directly to build investors’ trust in the market, recognising that economic reform would only be successful if companies and investors were in alignment. The government’s Financial Service Agency (FSA) introduced the Stewardship Code in 2014 and the Corporate Governance Code in 2015. These new guidelines laid the ground rules for engagement between companies and investors and raised the standard of corporate governance in Japan. The Stewardship Code covers a broad range of topics including board governance, ownership structure and total shareholder returns (Exhibit 8).
Exhibit 8: Corporate Japan is working to build investor trust with increased governance
Source: Japan National Tourism Organization, data as at June, 2020. OECD, data as at January, 2019. Mitsubishi UFJ Financial Group Research, data as at December, 2019. Note: Trust banks exclude investment trusts and pension trusts.
In 2014 Japan’s Government Pension Investment Fund (GPIF), the world’s largest pension plan, made the decision (approved by the government) to boost the portfolio’s domestic equity allocation to 25%, a notable increase from 11.1% in 2011 (Exhibit 9).5 In 2015 the GPIF also led the way in ESG matters by becoming a signatory to the UN PRI (United Nations Principles for Responsible Investment); this was a wake-up call for the Japanese investor community to boost awareness of responsible investing.
Abenomics set in motion real change and we believe government policy will remain supportive, with reform and monetary easing continuing to provide a positive impetus for Japanese companies.
Exhibit 9: GPIF asset allocation history
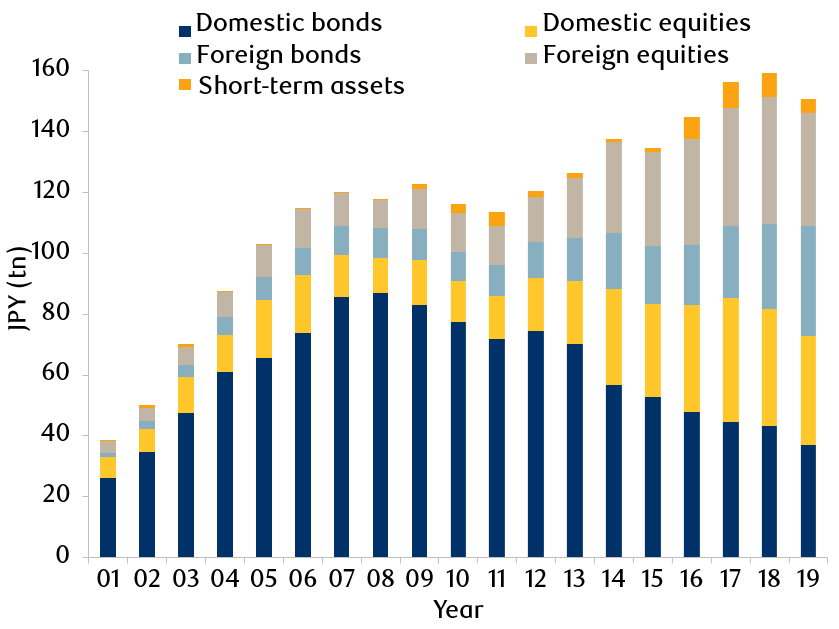
Source: Japan’s Government Pension Investment Fund. Data as at December, 2019.
Japan is now fertile ground for long-term stock pickers and active investment managers
Based on the data discussed above, there is significant evidence to indicate that structural change is under way in Japan and that companies and the equity market are moving in the right direction. There is still scepticism about investing in Japan, however, with some suggesting that the rate of change is too slow to be meaningful. This is why we believe this is a ‘quiet revolution’. Compared with western standards, it could be argued that in Japan return on equity (ROE) or profit margins are still too low; that dividends and share buybacks are not as substantial; or that cash levels are relatively high on balance sheets and that governance is weak. On the other hand it could also be argued that this is the reason why the Japanese equity market remains undervalued (Appendix Section 2). We believe the situation is conducive to longer-term opportunities and that this is the right time to be investing in Japanese equity. Also, the pace of change appears to be accelerating with progress more likely as momentum continues to build in the near term.
An overlooked asset class for such an extended period of time, Japanese equity is currently an under-researched market - across all market capitalization sizes - relative to its depth and liquidity.6 We believe this makes Japan a fertile ground for stock pickers and active investment managers. The comparison of sell-side coverage in Exhibit 10 illustrates this point clearly, and shows that the gap is most notable in small to mid-sized companies.
Exhibit 10: Sell-side coverage comparison across Japan, the U.S., and Asia
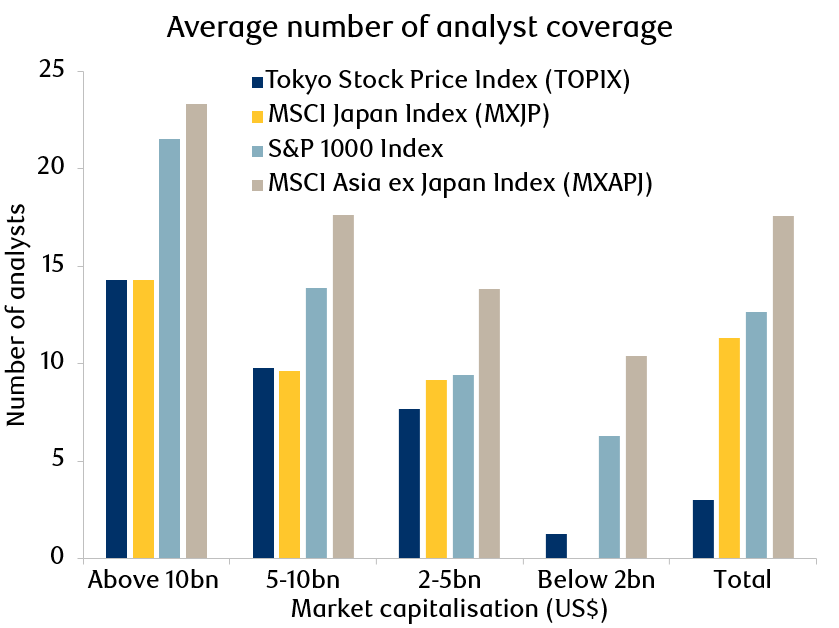
Source: RBC Global Asset Management. Bloomberg. Data as at January, 2020.
Our approach to Japanese equity
At RBC Global Asset Management, we consider 15%-20% of the Japanese companies we invest in to be hidden gems found among small to mid-sized companies. This has been an important source of alpha for us, however investment in this space is not without risk and stock picking is vitally important. Not only are small-cap companies generally riskier investments, and quality businesses harder to find, but there are additional challenges that are unique to Japan. Due to the lack of research coverage from the broader investment community, it is crucial for us to have our own rigorous, internal research process and insights to distinguish strong business models and trustworthy management.
As long-term fundamental investors, the RBC Asian Equity team makes investment decisions based on its strong in-house research capabilities with an emphasis on direct engagement with investee companies. The team not only understands Japan, but studies industry developments across the Asia-Pacific region, with each individual focusing on a specific sector. This allows for differentiated insights, and an understanding of Asia’s growing middle class with its strong demand for Japanese products that continues to drive growth for Japanese companies. The scope of research and engagement often extends beyond the Japanese company being researched, and to the Chinese or Indonesian company that represents the local competition. A portfolio of high conviction ideas that are vetted through robust team discussions aims to create a distinct track record that cannot be replicated by simple exposure to the MSCI Japan and TOPIX indexes.7
As we near the final quarter of 2020 we recognise that we are living in unusual times, with the global economy, and our society as a whole, still struggling with COVID-19. Geopolitical tensions across major economies continue to rise unabated and equity markets globally are more sensitive than ever to macro and political headlines. The political landscape in Japan will warrant particularly close attention in the next 12-18 months. We believe that in such uncertain and difficult times it is important to stay invested, based on long-term structural trends that we have confidence in. We believe that Japan’s quiet revolution offers attractive alpha opportunities for discerning active managers to invest in the fundamental transformation and valuation re-rating of the world’s second-largest developed economy.
APPENDIX
Structural change in Japan is moving in the right direction. Corporate Japan may lag the West in numerous key metrics but we believe that there are longer-term opportunities.
Section 1
Exhibit 11: Japanese equity history and underlying macro/fundamental variables
Source: Bloomberg, World Bank, Bank of Japan, Japan Ministry of Finance. Data as at December, 2019. Please see Appendix Section 1 for macro indicator data.
Source: Bloomberg, World Bank, Bank of Japan, Japan Ministry of Finance. Data as at December, 2019. NB: Margins, ROA & ROE from Corporate Survey by the Government.
Section 2
Exhibit 12: Operating profit margins comparison of major firms in Japan, Europe, and the U.S.
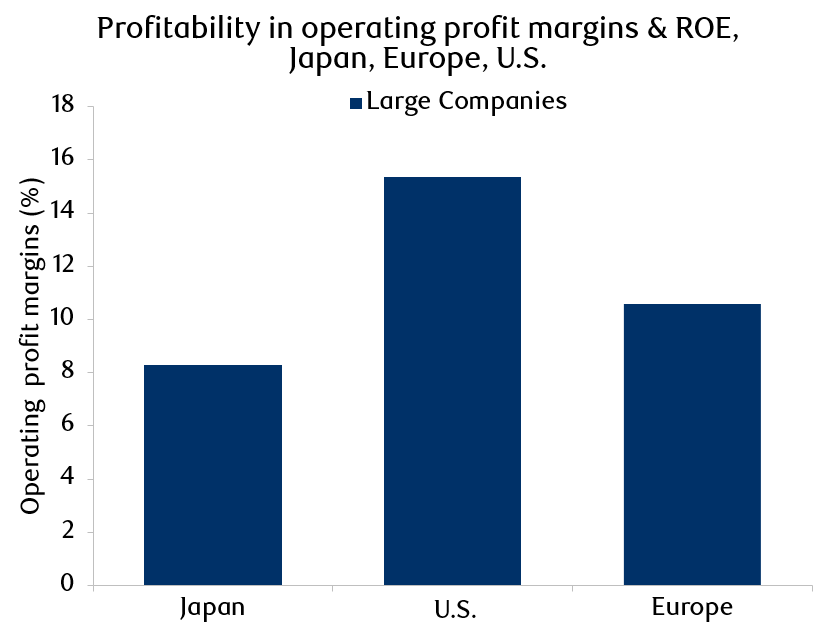
Source: MUFG Research, Bloomberg. Data as at Mar 2019 for Japan, Dec 2019 for EU and US. Notes: TOPIX (Japan), S&P 500 Index (US) and STOXX Europe 600 Index (Europe components: ‘Large companies’ = companies with annual sales of JPY 1trn or more (at JPY 105/USD, JPY 125/EUR). Source: MUMSS, from Bloomberg.
Exhibit 13: ROE comparison of firms in Japan and the U.S.
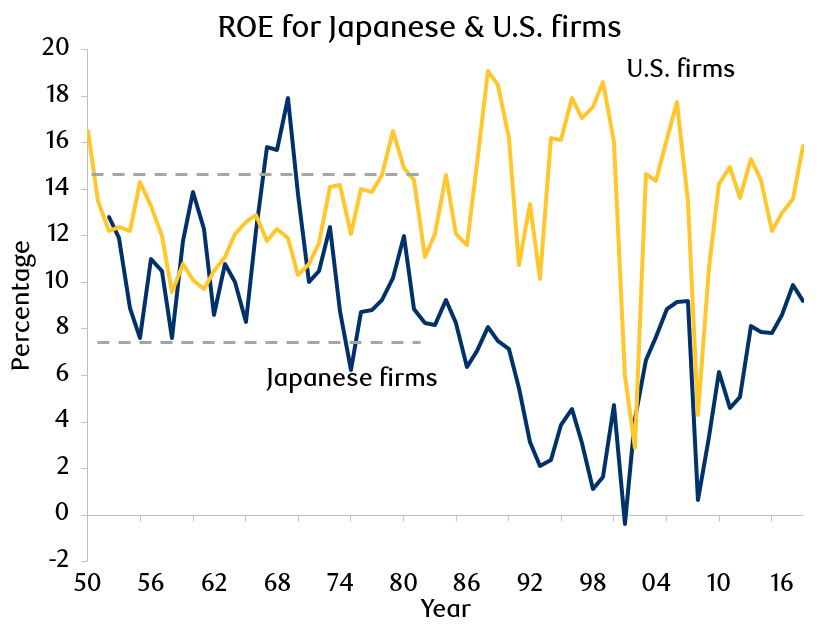
Source: MUFG Research, S&P, Bank of Japan, Nikkei. Data as at December, 2018. Note: U.S. data is based on S&P 500 Industrials Index for years prior to CY05, S&P 500 Index thereafter. Japan data is based on manufacturing in the BoJ ‘Financial Statements of Principal Enterprises’ through FY70, TSE1 companies (ex financials) for FY71 onwards, FY18 for Japan based on Toyo Keizai estimates.
Exhibit 14: Financial health and sustainability behind companies implementing share buyback in Japan, Europe, and the U.S.
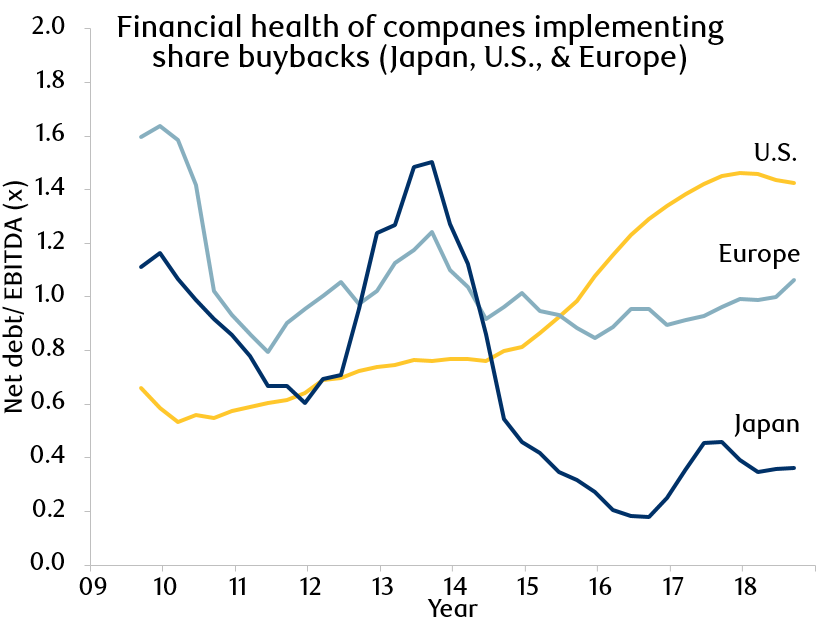
Source: MUFG Research, Factset. Data as at September, 2018. Note: S&P 500 Index for the US, STOXX 600 Index for Europe, and TOPIX 500 Index for Japan (excl. financials), net debt to EBITDA ratios of companies implementing share buybacks calculated in each quarter, 4 quarterly MA.
Exhibit 15: Corporate Japan balance sheet gearing history
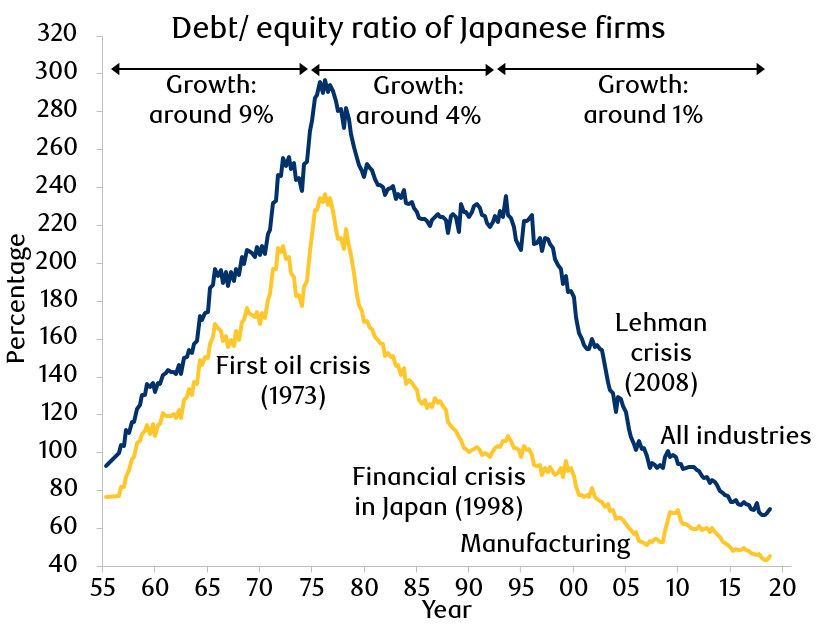
Source: MUFG Research, Japan Ministry of Finance Financial Statement Statistics. Data as at December, 2018. Note: Debt =short-term debt + long-term debt + corporate bonds; GDP growth.
Exhibit 16: Percentage of companies trading below book value, Japan, Europe, and the U.S.
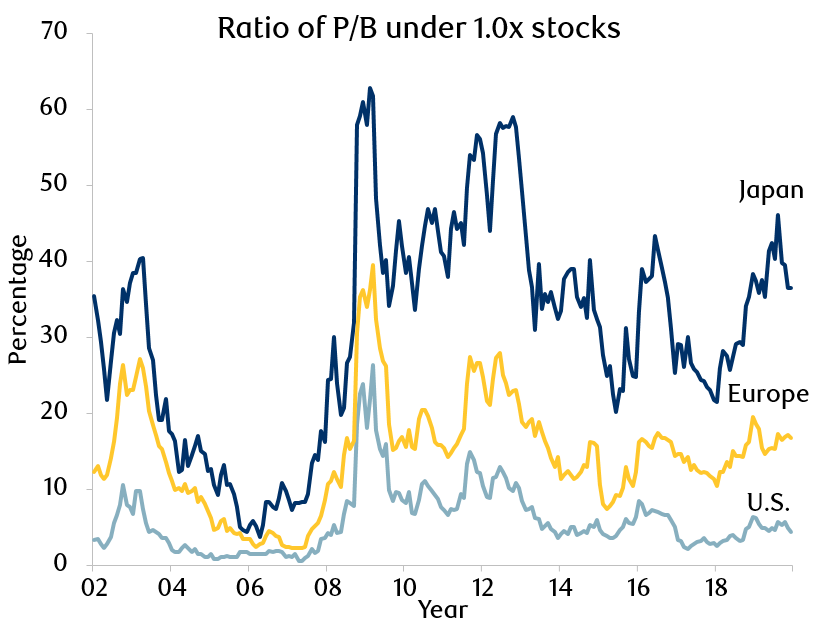
Source: MUFG Research, Bloomberg. Data as at June, 2020. Note: universe based on Japan=TOPIX 500 Index, US=S&P 500 Index, and Europe=STOXX 600 Index.
Exhibit 17: Japan equity price performance relative to other major indexes since the GFC
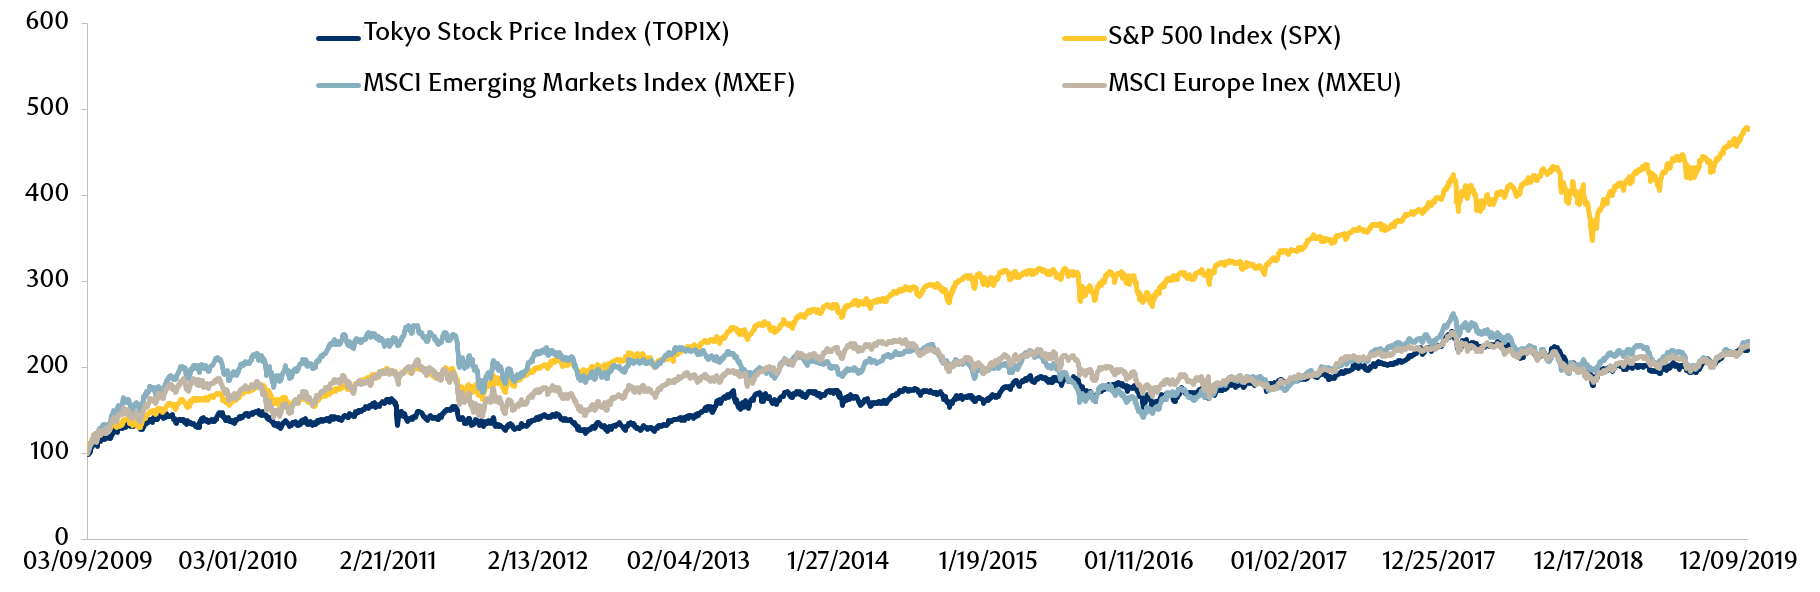
Source: Bloomberg, MSCI. All returns based on USD. Data as at December, 2019.
Get the latest insights from RBC Global Asset Management.