Overview
There are a mix of negative and positive developments recently. Negatives includes:
- Housing markets continue to weaken.
- Pandemic infections may be starting to rise again, though of admittedly little consequence for the economy or markets.
- The risk of recession remains quite high.
- Corporate earnings expectations still have to fall.
- We remain cautious on risk assets.
However, there are a significant number of important positives:
- The economic weakness so far is only minor.
- There are a number of hints that inflation could be close to peaking.
- Central bank tightening expectations have faded somewhat.
- Companies are no longer scrambling to build inventories.
- Supply chains genuinely appear to be improving.
Happier markets emerge
Risk assets have risen nicely over the past two weeks. This shift is seemingly motivated by optimism that inflation could be near its peak and thus that central banks may not have to raise interest rates quite as much as previously anticipated. Bond yields are accordingly a bit lower.
We feel similarly about inflation and central banks, though with the caveat that inflation is unlikely to plummet from here. Additional forces will be needed to restore normal inflation, including tighter monetary policy and weaker economic growth.
That said, one shouldn’t underestimate the potential damage that a recession can do to earnings and market valuations. It would be quite unusual for financial markets to be bottoming so early in the process, before economic weakness is even really visible. For these reasons, we remain cautious in our own investing stance, despite recent market happiness.
Key developments that might prompt a pivot toward more enthusiastic investment risk-taking include a few months of softening inflation and a significant downward revision to earnings expectations.
Pandemic eases
From an economic standpoint, the pandemic exerts less and less of an influence over daily life. Reflecting this, the global pandemic stringency index shows a steady reduction in government restrictions (see next chart).
Global Stringency Index shows steady easing

As of 06/26/2022. Global Stringency Index measuring the strictness of lock down policies that restrict mobility, calculated as stringency index of 50 largest economies. Sources: University of Oxford, International Monetary Fund, Macrofund, RBC GAM
However, this does not mean the pandemic is in permanent retreat. In fact, the Omicron BA.5 sub-variant is now taking over. It is causing a moderate increase in infections due to its greater infectiousness, alongside fewer restrictions and fading immunity (see next chart).
Transmission rate below one means COVID-19 is decelerating
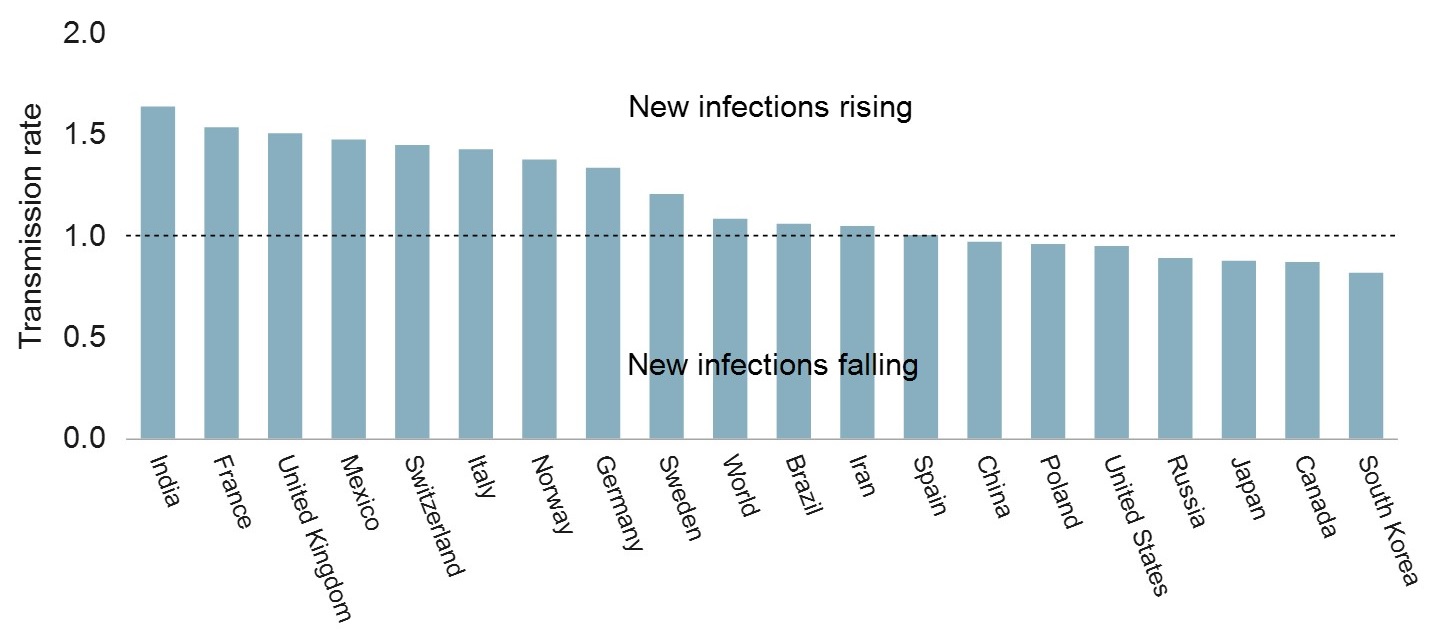
As of data available on 06/27/22. Source: Our World in Data, Macrobond, RBC GAM
European countries, in particular, are experiencing a rising case count. So far, the number of infections remains well short of the peak experienced in early 2022 (see Germany in next chart). Portugal experienced its surge in May, a little earlier than most other countries. Fortunately the wave has been short-lived as the country is already reporting significantly fewer new infections in June. In short, this wave doesn’t seem likely to significantly interfere with economic activity. The next question is what seasonal wave the colder months of fall and winter may bring.
COVID-19 cases and deaths in Germany resolving

As of 06/26/22. 7-day moving average of daily new cases and deaths. Source: Our World in Data, Macrobond, RBC GAM
Ukraine war grinds on
It is a familiar story in Ukraine. The media reports occasional Ukrainian victories versus Russia, but in practice Russia continues to acquire more land than it cedes. Most recently, Ukrainian troops withdrew from the city of Severodonetsk. Russia now has control over virtually all of the eastern province of Luhansk.
But Russia’s military progress is slow, and could yet reverse as Ukraine receives additional armaments from the West. It seems reasonable to expect a long, grinding war.
NATO is set to increase its forces on high alert from just 40,000 to 300,000. These are not expected to directly engage with Russia, but nonetheless represent an intensification of the conflict.
Economic restrictions remain more likely to rise than fall. Lithuania has begun to block Russian rail shipments to the isolated Russian outpost of Kaliningrad on the Baltic.
The European Union (EU) recently announced it will greatly limit its imports of Russian oil. The G7 is now expected to tighten restrictions on the commodity as well. Adding to the supply, the Organization of the Petroleum Exporting Countries (OPEC) has decided to increase its daily oil production by 250,000 barrels more than previously planned. This provides a partial offset. But it represents only around one-tenth of the necessary adjustment to fully compensate for a diminished Russian oil supply. The U.S. is expected to shortly announce additional military support for Ukraine plus yet another wave of sanctions on Russia.
Meanwhile, Russia blocked its natural gas from flowing to several European countries including Denmark, the Netherlands, Finland, Poland and Bulgaria. Germany is now receiving 40% less natural gas than normal from Russia via its main pipeline, albeit for what Russia says are maintenance-related reasons. European countries are beginning to activate emergency conservation plans. It seems likely that supplies will diminish further into the winter when demand is highest. This is not good for the European economy.
Lastly, Russia officially defaulted on its debt for the first time in more than a century. This is not a surprise as the country had been given a 30-day grace period, so the non-payment first arose a month ago. Russia’s inability to pay says less about its fiscal position, and more about a) its disdain for the West; b) its lack of dollars and euros; and c) its inability to transfer funds due to financial sanctions. Fortunately, the sums involved won’t break the global financial system.
Inflation peaks?
Inflation remains extremely high across much of the world (see next chart). We expect the U.S. to be a leading indicator whenever inflation starts to ease. Not only did it experience the inflation surge first, but theory confirms it should logically be a first-mover due to the dynamism of the economy the U.S. annual rate of inflation has already seemingly stabilized in recent months versus a continued acceleration elsewhere.
Inflation reaches multi-decade high in major economies

As of May 2022. Source: Bureau of Labor Statistics, Office for National Statistics, Statistics Canada, Statistical Office of the European Communities, Haver Analytics, RBC GAM
We have constructed a scorecard to gauge whether U.S. inflation is peaking (see next table). Of the 19 inputs, 8 presently say “no”, 9 say “maybe” and 2 say “yes.” This may not sound like much, but two months ago all 19 said “no.” There is progress occurring, even if very few are firmly in the “yes” column.
U.S. inflation peaking scorecard

“Turning” identified using mix of M/M and Y/Y methodologies. “Pandemic-boom goods” include used vehicles + sports vehicles (including bicycles). Source: RBC GAM as at 2022-06-23.
What should turn first?
What components of inflation should turn downward first? There are a few ways of answering this question.
Historically, such inflation categories as food and motor fuel tend to be among a handful of variables that significantly lead the broader inflation print.
One might also argue that items that experienced particularly intense inflation during the pandemic – such as cars, bicycles and electronics – should be particularly susceptible to reversal. One would also expect commodity prices to roll over fairly quickly into an economic downturn as demand destruction occurs, consistent with the historical experience. Lastly, one might imagine that goods inflation should ease before services inflation to the extent that high inflation is in significant part due to excessive demand for goods relative to services.
Providing a similar perspective, a decomposition of U.S. inflation finds that nearly half of the price increase over the past year comes from the transportation sector – an awkward but potent combination of fuel costs plus vehicle costs (see next chart). Another quarter or so comes from the combination of housing and food inflation.
Transport, housing and food are driving U.S. inflation

As of June 2022. Source: U.S. Bureau of Labor Statistics (BLS), Macrobond, RBC GAM
In practice, some of these things are now starting to turn. Used car prices are softening and a range of commodity prices are now falling. Oil company stocks have recently tumbled on expectation that oil prices may ease from here. Housing markets are most certainly turning lower – though dwelling costs act with a considerable lag on the Consumer Price Index (CPI). Now some basic foodstuffs are beginning to record falling prices.
Commodity prices decline
A range of commodity prices have begun to fall. This is in part as worst-case scenarios with regard to Russian exports were avoided, but mainly due to expectations of weaker demand in the future as the economy weakens. Base metal prices are lower, including copper (see next chart). Copper is thought to be a leading indicator for the economy.
Copper prices fell recently on global growth concerns

As of 06/24/2022. Shaded area represents U.S. recession. Source: London Metal Exchange (LME), Bloomberg, RBC GAM
Oil prices are high, but not as high as they were (see next chart).
Crude oil prices remain elevated as Russia’s invasion drags on

As of 06/24/2022. Source: Macrobond, RBC GAM
Lumber prices have fallen sharply on reduced renovation plans and likely diminished housing market expectations (see next chart).
Lumber prices have fallen sharply

As of 06/14/2022. Source: CME Group, Macrobond, RBC GAM
Finally, and representing a turn that had until recently been elusive, wheat prices are now falling sharply (see next chart).
Prices have retreated as wheat harvest gets underway

As of 06/24/2022. Shaded area represents U.S. recession. Source: S&P, Macrobond, RBC GAM
There are no guarantees these downward moves will persist, but all it takes for inflation to ease is for commodity prices to stop rising.
Supply chain improves
Another key driver of inflation has been supply chain problems. This is still a messy subject with Russian sanctions, recurring Chinese lockdowns and still-distorted pandemic spending patterns. Some supply chain problems appear set to remain elusive for years to come, and we are alert to the fact that the holiday procurement rush is already nearing.
But some supply chain issues are most definitely improving. The cost of shipping a container has continued to decline and is now back to levels from a year ago (see next chart).
Shipping costs ease further

As of the week ending 06/23/2022. Source: Drewry Supply Chain Advisors, RBC GAM
At the same time, manufacturers are complaining much less about supplier delivery times, and they expect a further improvement in the future (see next chart).
Current and expected supplier delivery times improve

As of May 2022. Equal weighted average of current and expected supplier lead times. Source: Federal Reserve Bank of Dallas, Kansas, New York, Philadelphia, Richmond, Macrobond, RBC GAM
Breadth
Of course, pitted against all of this welcome news is the astonishing breadth of high inflation today (see next chart). While the greatest inflationary impulses are concentrated in a handful of sectors, inflation is now also running quite high across a wide range of products. This should make inflation more resistant to normalization even if commodity prices and supply chains become less problematic. The Bank of International Settlements recently warned that inflation is at risk of leaping from a cyclically high state to a structurally high state. The path to this travels through broad, sustained high inflation.
Fortunately, we do not ultimately expect this outcome. Instead, we anticipate that inflation will peak within the next few months and then make a gradual journey back to more normal levels.
Inflation in the U.S. has broadened significantly

As of May 2022. Share of Consumer Price Index (CPI) components with year-over-year % change falling within the ranges specified. Source: Haver Analytics, RBC GAM
Japanese perspective
Japan’s perspective on high inflation is different, for three reasons:
- It has only just now experienced a significant surge in inflation (see next chart).
- Its inflation rate – at 2.5% – is three times lower than in other developed countries and so less problematic.
- Japan has been plagued by decades of too little inflation.
Thus, it views this higher inflation as an opportunity to reset the country’s inflation expectations in a way that might allow it to permanently escape from the purgatory of deflation.
Japanese inflation reaches highest level in three decades

As of June 2022. Source: Japanese Statistics Bureau, Ministry of Internal Affairs & Communications, Macrobond, RBC GAM
Markets have been skeptical that Japan can resist monetary tightening when so many others are engaged in it. After all, Japanese inflation may not be approaching double digits, but it is nevertheless the highest rate since 1991. So far, the Bank of Japan has pushed back aggressively against speculators, defending its 10-year yield target. Much will depend on where Japanese inflation goes from here, and the extent to which the yen depreciates. If the Japanese inflation experience is to remain several-fold less intense than elsewhere, the Bank of Japan can probably hang onto current negative rates. But if Japanese inflation continues to surge (or the currency continues to fall – as a precursor to future inflation), then action could eventually be necessary.
Is it stagflation?
As the world grapples with high inflation and the possibility of weaker economic activity, an obvious question is whether this constitutes the dreaded “stagflation.” Our answer comes in three parts.
- Stagflation is not happening right now. Inflation is quite high – half of the recipe – but economic growth is still decent for the moment.
- Stagflation, if broadly defined, is likely to occur at some point over the coming 18 months. This is to say, there will likely be a moment when the economy has weakened while inflation remains temporarily too high. This could be called stagflation, though we are inclined to think that stagflation is meant to refer to an era, not just a snapshot in time.
- We do not expect stagflation to endure for years, let alone for it to constitute an era like the 1970s. Economic growth is unlikely to be great shakes over the long run (mainly due to demographic challenges) and inflation could be a little higher than we are used to, but neither to the extent of warranting the stagflation moniker.
Economic signals hold steady
In assessing economic weakness, we are looking for two main things:
- evidence of weaker consumer spending
- evidence of weaker business investment and/or hiring.
Both remain fairly hard to find. Consumer and business confidence have fallen significantly in the face of many simultaneous headwinds, and in many countries (see next chart), but real economic activity has been more resilient.
Consumer confidence: U.S., euro area and U.K.

As of June 2022. Shaded area represents U.S. recession. Source: The Conference Board, European Commission (DG ECFIN), GfK UK, University of Michigan, Macrobond, RBC GAM
A glance at real-time consumer spending data fails to reveal any sudden retreat (see next chart). That said, the roughly flat line may be less benign than it first seems, in part because the spending is being compared at all times to 2019 – so the fact that spending is roughly the same percent higher than 2019 in both 2022 and 2021 actually suggests little spending growth over the past year.
Further, with inflation so high over the past year, the inflation-adjusted amount of spending in 2022 would appear to be somewhat weaker yet. Conversely, as people return to brick-and-mortar stores, they may be shifting a fraction of their spending back to cash transactions. These transactions are not picked up in the card data used to construct this series. Balancing these considerations, one might argue that consumer spending growth isn’t as good as it first looks, but neither is it suddenly collapsing as one might expect if a recession were beginning right now.
U.S. aggregated card spending holding steady

As of the week ending 06/14/2022. Based on card transaction data of brick-and-mortar merchants, collected by Fiserv. Excludes gas stations. Source: BEA, Haver Analytics, RBC GAM
So far, corporations are not yet significantly scaling back their investment and hiring plans. There are little hints here and there of a smidgen of diminished activity, but nothing major, and nothing in line with the material drop in business confidence recently observed. It still seems likely that business activity will cool in the future, but not much has happened so far.
As discussed earlier, copper prices and oil prices have recently fallen. Both are classic indicators of anticipated economic weakness.
On the other hand, demand for certain previously pandemic-constrained services such as travel continue to boom. U.S. air travel has now returned to its pre-pandemic level in the U.S. (see next chart).
Air travel in the U.S. returns to pre-pandemic level

As of 06/26/2022. 7-day moving average of TSA passenger throughput. Source: U.S. Department of Homeland Security, Macrobond, RBC GAM
Recession risk
Despite continued economic resilience, the recession risk bell continues to chime. There are several recent items to highlight.
A recent Wall Street Journal survey of economists assigned a 44% chance of a recession over the next 12 months. That’s a lot higher than normal – the assigned risk was just 18% in January – and it is notable that economists tend to be quite conservative (too conservative!). A 44% chance is rarely assigned without a recession subsequently occurring.
The Bank of International Settlements (BIS) recently conducted a study of the monetary policy tightening cycles in 35 countries and what happens afterward. This represents a significant upgrade from the usual analysis that focuses only on the U.S. The BIS found that around half of the tightening cycles resulted in recession, and around half in soft landings. That’s better odds than a simplistic analysis of the U.S. experience. However, additional analysis showed that recessions were more likely if monetary tightening was preceded by extremely low borrowing costs and by rising financial vulnerabilities. Both are the case this time.
The New York Fed runs a large-scale econometric model that now predicts a 1% decline in Gross Domestic Product (GDP) over a four-quarter period. That would very likely constitute a recession. While plenty of others predict or warn of recessions, it is quite rare for such econometric models to offer such predictions. In turn, the prophecy must be taken seriously.
In what may end up being a red herring, U.S. GDP shrank by 1.5% annualized in the first quarter of 2022 and is now predicted by the Atlanta Fed’s nowcasting model to have been flat in the second quarter of 2022. That means even a slight disappointment in the second quarter would yield two consecutive quarters of declining GDP – a rule-of-thumb for a recession. We aren’t convinced the second quarter will actually land at a negative level, but the main point is that any such occurrence wouldn’t be the “real” recession. The first quarter GDP decline was an artificial drop that happened due to a weird inventory pattern and a surge in imports, not because the economy was keeling over. Most of the economic data we’re seeing for the second quarter doesn’t seem consistent with a recession, whatever the ultimate GDP print. In other words, a recession didn’t just happen – but it is at risk of happening over the next 18 months.
Central banks continue raising rates
Central banks continue to raise rates aggressively. Indeed, the U.S. Federal Reserve delivered a massive 75 basis point rate increase in mid-June, the largest such increase since 1994. A further 75 basis point increase is likely at the next meeting. It is remarkable how much market expectations have increased over the past nine months (see next chart).
Market expectations of Fed hikes have shifted

As of 06/13/2022. Source: Bloomberg, RBC GAM
However, it is notable that in the weeks since the Fed decision, the market has actually pivoted, removing a full 25bps rate hike from the expected peak policy rate. We may now be beyond the peak Fed tightening expectation, if not the peak fed funds rate. Our suspicion is that central banks are currently overpromising relative to what they may ultimately need to do. In an ideal scenario, their tough talk pulls inflation down, without requiring the full allotment of tightening.
Insolvent Fed?
One fascinating aside is that, now that bond yields have backed up so much (and bond prices accordingly declined), the Fed may technically be insolvent. It has lost hundreds of billions of dollars on a market valuation basis from its trillions of dollars of bond holdings. In contrast, its level of capitalization is well short of that. Fortunately, this doesn’t actually matter much, for three reasons:
- If needed, the Fed can print money to restore its capitalization.
- If needed, the Fed could receive financial support from the government.
- Even though the Fed is now shrinking its bond portfolio and is thus at theoretical risk of crystalizing losses, in practice it is doing so by allowing bonds to mature. Bonds mature at their par value, meaning that no actual losses will have to be realized.
Eurozone periphery
The European Central Bank (ECB) is now on the cusp of raising its policy rate by 25 basis points next month. This is a momentous occasion, as the policy rate has been held fixed in negative territory for a long time. As the ECB moves to remove stimulus, it is also ending its bond-buying program. This has had much the same effect as in other countries, but has also helped to compress the borrowing costs of some of the bloc’s riskier countries. As the bond-buying program nears an end, the cost of borrowing for the likes of Greece and Italy are again widening significantly versus safer countries like Germany (see next chart).
Eurozone periphery-German yield spreads have risen on rate hike worries

As of 06/24/2022. Spread of Eurozone periphery countries and German 10-year government bond yields. Source: Macrobond, RBC GAM
There is accordingly the risk of another sovereign debt crisis, much as plagued Europe across the 2010s. Fortunately, the extent of the problem appears much smaller based on the current behavior of spreads. The ECB is formulating plans to prevent a bad outcome, presumably by a scheme that ensures borrowing costs do not gap too wide between its member states via bond purchases in one jurisdiction financed by bond sales in another.
Housing weakness continues
Housing weakness continues to become more visible as higher borrowing costs bite.
U.S. housing
The U.S. mortgage market revolves around a 30-year term. This means that existing homeowners are little affected by rising rates, but prospective home buyers are impacted massively.
Existing home sales are down sharply and mortgage applications are beginning to retreat (see next chart).
U.S. new mortgage applications are starting to retreat

As of week of June 13, 2022. Source: Mortgage Bankers Association (MBA), Macrobond, RBC GAM
Various measures of U.S. housing market expectations show a similar decline (see next chart).
U.S. housing market expectations also declining

As of April 2022. Source: The Real Estate Roundtable, National Association of Home Builders, Macrobond, RBC GAM
While home construction has not yet materially slowed, it should. Not only is demand weakening, but the materials needed to construct a house are nearly twice as expensive as they were just two years ago (see next chart).
Cost of commodities to build a house have risen

As of June 2022. Source: Ro-Mac Lumber & Supply, Macrobond, RBC GAM
Fortunately, we continue to view the prospect of a weaker housing market as a moderate drag on the economy, rather than as a financial crisis in the making. Critically, the quality of the mortgage market is much higher than it was 15 years ago, as evidenced by much better credit ratings today (see next chart).
U.S. mortgage originations have far higher quality today

As of Q1 2022. Source: Federal Reserve Bank of New York, Macrobond, RBC GAM
Canadian housing
Canadian housing is clearly weakening, and we believe has more downside potential than in the U.S. This is by virtue of worse affordability and a bigger run-up in prices during the pandemic. Existing home sales have now fallen sharply, albeit just back to pre-pandemic levels at this point (see next chart).
Canadian existing home sales weaken

As of June 2022. Source: Canadian Real Estate Association, Macrobond, RBC GAM
Existing home prices are now clearly falling, not just in the smaller markets that soared the most over the past few years, but also in larger cities and indeed across the country (see next chart). There is more to come.
Canadian home prices by market are clearly falling

As of June 2022. Source: Canadian Real Estate Association, Macrobond, RBC GAM
Inventories pivot
An economic tailwind over the past year has been the desire by businesses to rebuild their inventories.
That attitude now appears to be changing. Truthfully, it can’t be said to be visible in the aggregate U.S. inventory data (see next chart). Yes, retail and wholesale inventory ratios are rising, but they still seem low. And while manufacturing inventories appear to be too high and are declining, they have been declining steadily for the last few years, suggesting no need for a sudden change in attitude now.
Most U.S. nominal inventory-to-sales ratios remain low

As of April 2022. Source: U.S. Bureau of Economic Analysis (BEA), U.S. Census Bureau, Macrobond, RBC GAM
Despite a lack of a silver bullet, attitudes about inventories do appear to be changing. A growing number of businesses indicate that they have enough inventories or even have more than they want. Prominently, Amazon over-expanded during the pandemic and is now attempting to shrink back down. There are also many smaller businesses that feel they are suddenly holding too much inventory.
What does this suggest? If the anecdotes are correct, it means:
- Weaker economic growth in the future. Historically, the inventory cycle was a big part of the economic cycle. It isn’t clear that it continues to deserve that outsized reputation, but less inventory building does still equal less economic growth.
- There should be fewer supply chain pressures now that businesses aren’t trying to jam through customers’ orders plus their own inventory-building initiatives through the same limited pipeline.
- Inflation pressures could ease, in part due to improved supply chains, and in part because some businesses may be in a hurry to dispose of their excess stock.
Overall, this seems more good than bad given that fixing distortions and controlling inflation are greater priorities than keeping the economy going right now.
-With contributions from Vivien Lee, Andrew Maleki and Aaron Ma
Interested in more insights from Eric Lascelles and other RBC GAM thought leaders? Read more insights now.