Overview
The economic recovery from COVID-19 continues. Most developed countries are managing incrementally fewer infections and deaths. However, the global virus count is still rising, largely due to struggling emerging market nations. Financial markets have been unnerved by a combination of higher infections in certain U.S. states and predictions by the U.S. Federal Reserve that the economic recovery will be quite gradual.
Virus update
The virus trends remain mostly familiar. The number of global daily infections continue to rise. But the – arguably, more accurate – fatality figures continue to rend roughly sideways (see first chart).
Spread of COVID-19 globally, cases and deaths
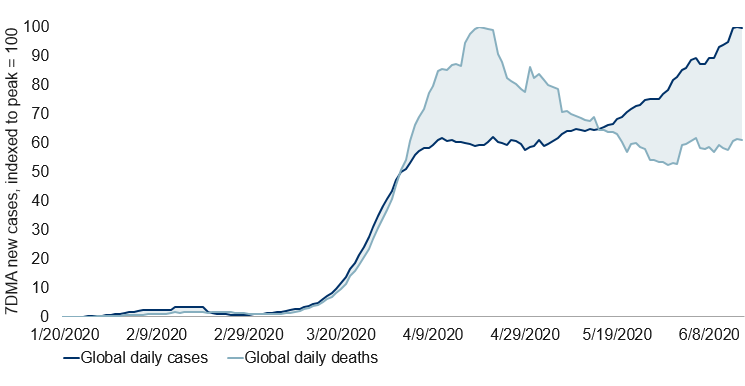
Note: As of 06/15/2020. 7-day moving average of cases & deaths indexed to 100. Source: ECDC, Macrobond, RBC GAM
Emerging market countries continue to suffer the bulk of the rising caseload (see next chart).
COVID-19 hitting emerging market countries now
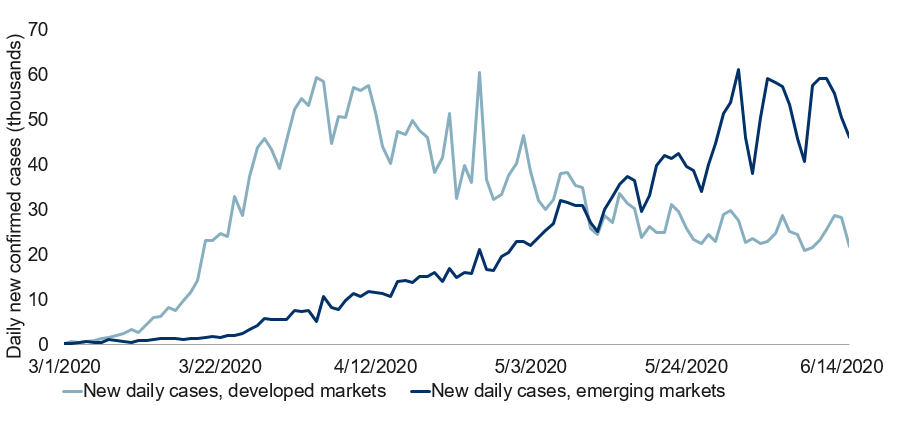
Note: As of 06/15/2020. DM aggregates case count from France, Germany, Italy, Spain, U.K. and U.S., and represents 41.1% of global cases. EM aggregates case count from Brazil, India, Iran, Peru, Russia and Turkey, and represents 29.4% of global cases. Source: ECDC, Macrobond, RBC GAM
For example:
- Pakistan is increasingly struggling after opting to discontinue its quarantine for economic reasons.
- India continues to deteriorate, to the point that the country is now implementing stricter social distancing again in some regions.
- Brazil – which had recently claimed the mantle of most daily cases from the U.S. – has somehow sharply reduced its infections over the past week (see next chart). Time will tell whether this proves sustainable.
Spread of COVID-19 in Brazil
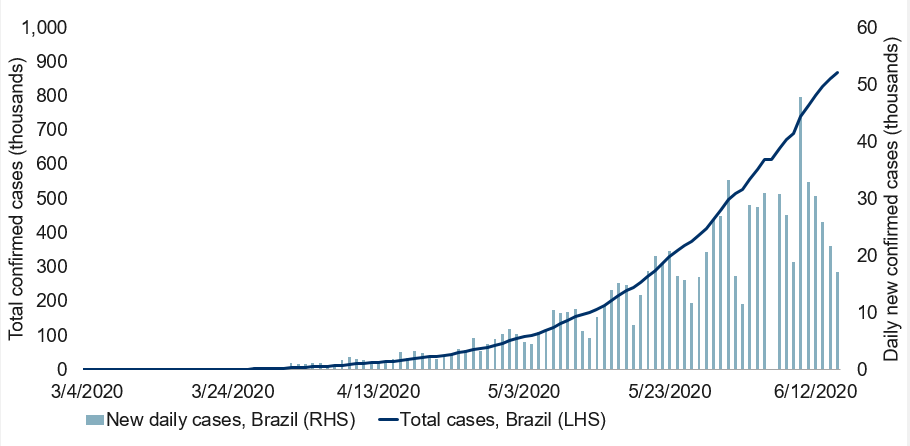
Note: As of 06/15/2020. Source: ECDC, Macrobond, RBC GAM
China has captured headlines lately with an outbreak of COVID-19 in Beijing. But given the country’s past success at taming the virus and the small number of new infections in an absolute sense (79), this is unlikely to be an enduring problem.
In the developed world, the U.S. remains steady at around 20K to 25K new cases per day. However, this masks significantly different transmission rates depending on the state (see next chart). Fully 24 states are now experiencing a rising trend.
Transmission rate, U.S. states
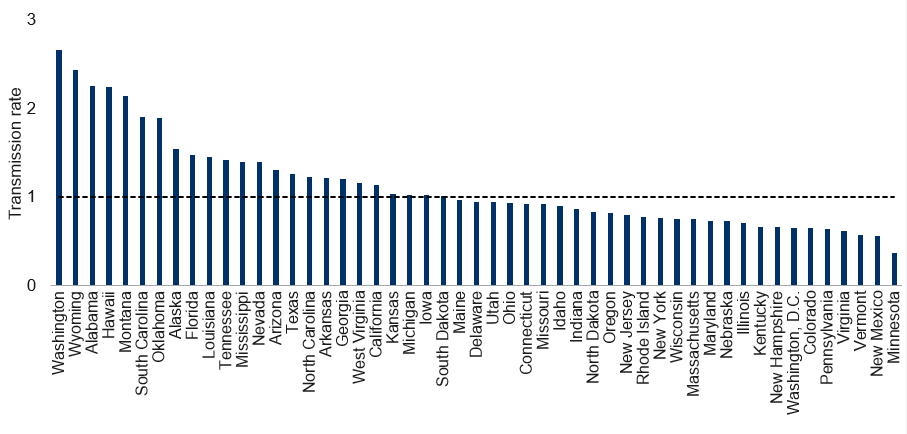
Note: As of 06/14/2020. Transmission rate calculated as 7-day change of underlying 5-day moving average of new daily cases. States below dotted line at one have decreasing new daily cases. Includes D.C. Source: The COVID Tracking Project, Macrobond, RBC GAM
Problem spots include large states such as Florida, Texas and California. Florida has now easily exceeded its prior peak daily infections and continues to rise (see next chart). We continue to believe that many of these states will lack the political will to mandate a significant reduction of social mobility for a second time. Instead, they will likely put the onus on individuals and businesses to reverse course voluntarily.
State of Florida
Note: As of 06/14/2020. 7-day moving average of daily new cases used as trendline. Source: The COVID Tracking Project, Macrobond, RBC GAM
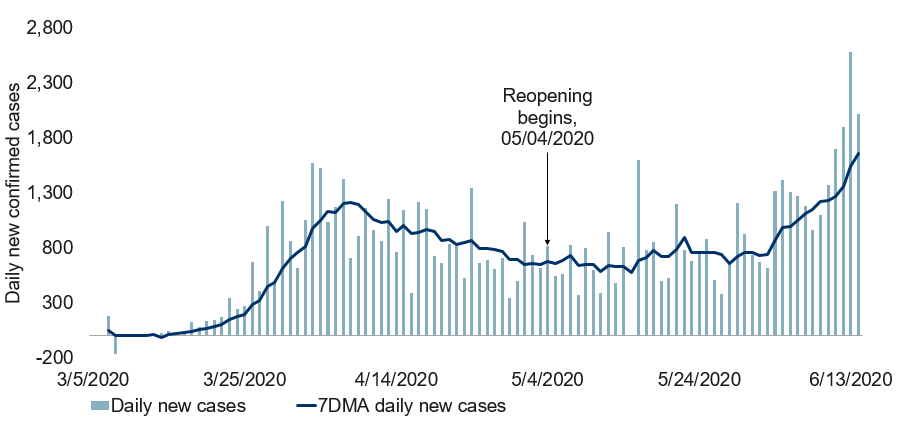
Canada’s COVID-19 count continues to improve quite nicely (see next chart), while the U.K. caseload has lately been stagnating after big earlier improvements.
Spread of COVID-19 in Canada
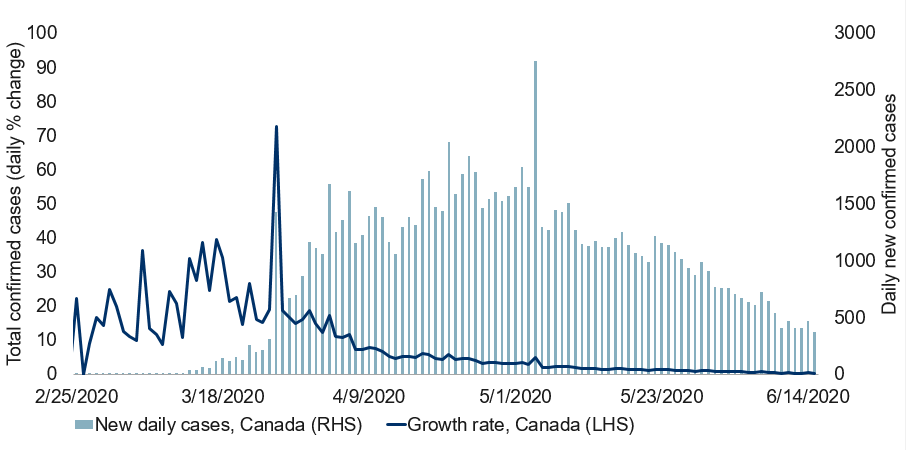
Note: As of 06/15/2020. Source: ECDC, Macrobond, RBC GAM
Business cycle update
We have long maintained a business cycle scorecard, with the intent of better anticipating and understanding the business cycle. Normally, we would have conducted our regular quarterly update in late April, but three things interfered:
- It was already crystal clear that a recession was underway, reducing the value of the effort.
- The recession had nothing to do with the business cycle, arriving due to a completely exogenous shock.
- In the early going of COVID-19, there were many other pressing questions to answer.
Now, with the luxury of time, we are able to go back and fill in what would otherwise be a gaping hole in our business cycle record-keeping. To be clear, this effort focuses on the period up until April, but not beyond. As such, while we are reasonably confident that an economic recovery is now underway, this business cycle analysis cuts off around the economic trough.
Unsurprisingly, the business cycle scorecard points overwhelmingly toward recession. This is the first time the scorecard has been put through its paces at this point in the cycle, and it appears capable of successfully identifying them (see next table).
U.S. business cycle scorecard
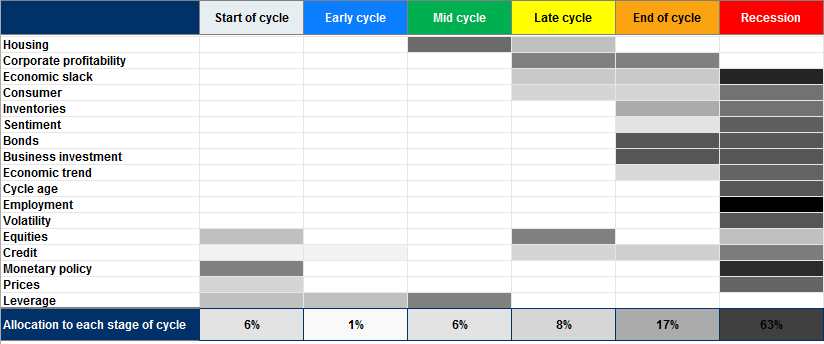
Note: As at 04/30/2020. Darkness of shading indicates the weight given to each input for each phase of the business cycle. Source: RBC GAM
Inevitably, there are always a handful of inputs that don’t align with the broader conclusion. The housing market – at least through the period analyzed – held up, for instance. Straddling the main conclusion, a significant subset of inputs gave a nod toward “end of cycle”, and a few were even beginning to point toward “start of cycle” in April.
We also monitor a variety of models that specifically focus on the probability of a recession, ignoring the other phases of the cycle. Some have failed to identify the latest recession, in particular those that imagine recessions originate from financial condition shocks. That wasn’t the cause of this latest episode. Fortunately, some of these models were precisely on the mark, including a St. Louis Fed model replicated below.
Macro-based U.S. recession probability
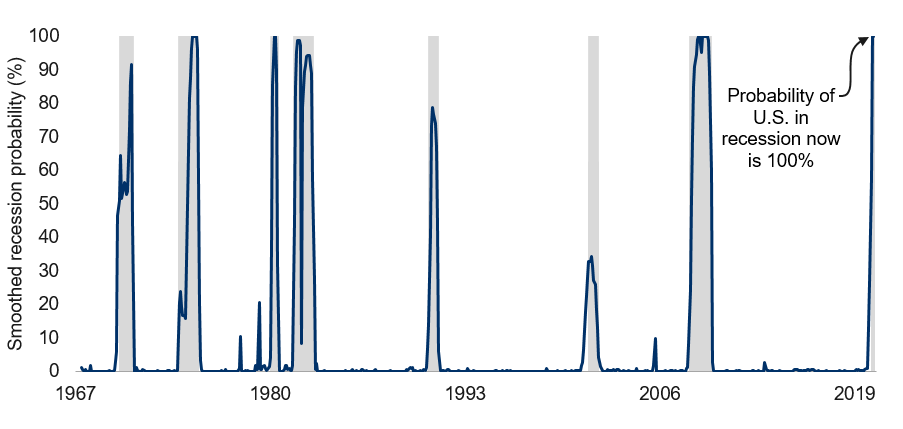
Note: As of March 2020. Recession probabilities estimated using a dynamic-factor Markov-switching model and four monthly coincident variables: non-farm payroll employment, industrial production, real personal income excluding transfer payments, and real manufacturing and trade sales. Shaded area represents recession. Source: Federal Reserve Bank of St. Louis, Haver Analytics, RBC GAM
Economic developments
Real-time economic data mostly continues to rebound. Mobility metrics continue their upward trajectory nearly everywhere (see next chart).
Severity of lockdown varies by country
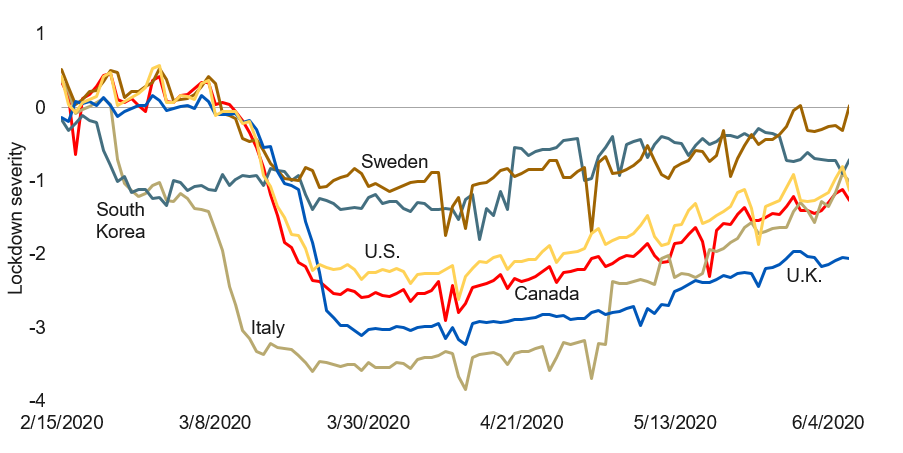
Note: As of 06/07/2020. Deviation from baseline, normalised to U.S. Source: Google, University of Oxford, Apple, Macrobond, RBC GAM
Many high-frequency indicators point to a decelerating rate of improvement. For instance, U.S. business sales merely recovered from 25.3% below their earlier peak to 25.0% below the peak in the latest week. Similarly, the U.S. hours worked survey appears to be improving less quickly than before (see next chart).
Percentage change of hours worked by hourly workers in the U.S.
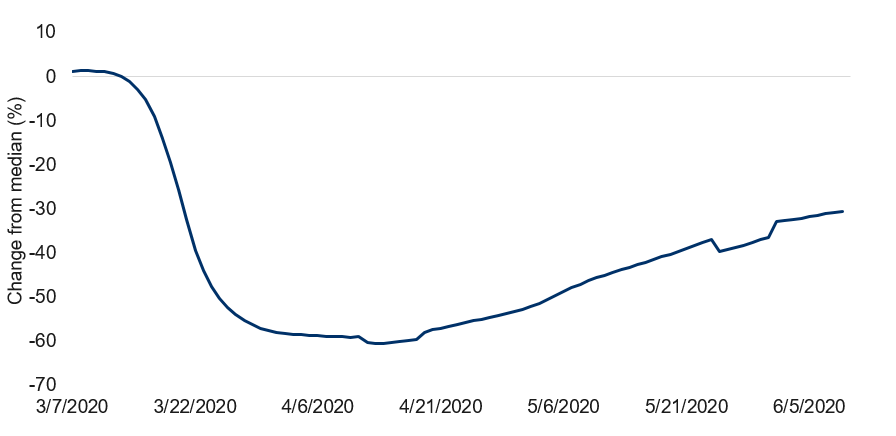
Note: As of 06/13/2020. Impact compares hours worked in a day vs. median for the same day of the week in January 2020. 7-day moving average used. Source: Homebase, Macrobond, RBC GAM
Housing resilience
It is still early going for the housing market. As this period of elevated unemployment stretches on, there may well be further damage that accrues later. But, for the moment, housing metrics are mostly surprising to the upside.
- In the U.S., mortgage applications have now staged a full recovery. This is frankly astonishing given the level of unemployment and the large amount of uncertainty, but it is nevertheless the case.
- In China, home prices are rising again – consistent with a 6% annualized growth rate.
- In Canada, housing starts have rebounded to a near-normal level (194K in May). Existing home sales have bounced an extraordinary 57% in May (though the absolute level is still somewhat below March levels).
U.S. miscellany
U.S. weekly initial jobless claims continue to improve incrementally, down from 1.9M new jobless applicants a week ago to 1.5M in the latest week.
The Empire Manufacturing index – the first major precursor to the closely-watched ISM (Institute for Supply Management) Manufacturing Index – took a major leap forward in June, recording a 0 print. This is not a great number by itself, but nevertheless represents a gigantic leap beyond the expected -29 reading, the prior reading of -48 and the all-time low of -78 in April. If the other regional indicators give a similar reading, this implies a decent 50 reading for the broader ISM figure.
Deflationary pressures continue to dominate in the short run, as we had been predicting. U.S. headline and core CPI (Consumer Price Index) both fell 0.1% in the month of May. Later, we suspect the tide will begin to turn.
Looking ahead, the U.S. is on the cusp of releasing retail and industrial production data for May. After a 24% drop over the prior two months, retail sales are expected to reclaim a third of the decline (+8%). The story is less exciting for industrial production, where only about one-fifth of the earlier 15% drop is expected to be recovered.
Chinese data
China’s big economic data dump for May has occurred. The country continues to map a course back to economic normality, with retail sales now down just 3% YoY (relative to a “normal” +8% and a trough of -16%). Remarkably, industrial production is now actually higher than a year ago, up 4% (versus a +6% “normal” and a low of -1%).
Questions remain about the extent to which the Chinese economy can continue growing even as the rest of the world has suffered a calamitous drop. But the data so far argues the country’s recovery continues largely uninterrupted.
International economic damage
The U.K. economy has reported a sharp 20% decline in April GDP, loaded on top of a 6% decline in March. All told, this roughly 26% decline is even worse than the 23% drop we had assumed for the country. And recall that our forecasts are mostly below the consensus.
The U.K. is among the worst affected developed economies for a number of reasons:
- It mishandled the initial outbreak of the virus, resulting in a heavier caseload per capita than most other countries.
- Consequently, it has implemented a tougher set of quarantine measures.
- It has been slower to lift its quarantine.
- Brexit continues to depress risk-taking and elevate uncertainty.
By way of comparison, Canada’s April GDP figure was previously estimated at -11% – a severe blow to be sure, but much milder than the U.K. number. Unfortunately, some sectors are hit worse than others. Canadian manufacturing sales for April now reported to have declined by a sharp 28% (worse than the -20% consensus).
Data contradictions
Economic analysis is always awash in contradictory data, but never more so than now. The combination of brand new, untested metrics and severe gyrations reveal huge disagreements between theoretically similar indicators.
Redbook versus credit card data: U.S. Redbook retail sales data argue that around one-fifth of the initial economic decline has been recovered, whereas credit card data claims that the rebound is as much as four-fifths. The two measures don’t have exactly the same coverage, but they are similar. A peace-maker might opt to emphasize that both now claim that activity is around 10% below the pre-COVID norm. But this hardly solves the mystery to the extent that one had first bottomed at -13%, while the other bottomed at -54%.
In what will soon prove a common theme, we believe the reality lies somewhere in the middle. Indeed, officially retail sales fell by 24% into April, splitting the difference.
Payrolls versus continuing claims: According to payroll employment data, the U.S. added 2.5 million net workers between roughly mid-April and mid-May. At the same time, the number of Americans receiving jobless benefits appears to have swelled by around 13 million. Even factoring in reports of mismeasurement and the fact that a significant fraction of the people entering the job market in the latest month came from outside of the labour force altogether, this is hard to reconcile.
Apple Mobility versus Google Mobility versus CityMapper Mobility: These three organizations collect mobility data from people’s cell phones and their use of online mapping technologies. But the results are quite different. The Apple Mobility data claims that Americans and Canadians are outright driving more than they did before COVID-19 came along. This is hard to fathom given that far fewer people are commuting to work. At the opposite extreme, the CityMapper data suggests that New York City mobility has merely recovered to around 10% to 15% of normal, and that Toronto mobility is back to 20% to 25% of normal. This is also hard to believe as someone who recently drove on a Toronto highway. The Google Mobility data lands somewhere in the middle. Once again, the truth likely lies somewhere in the middle.
The bottom line is that we are working with flawed data. The solution in most cases isn’t to select the single best indicator but to combine them into a more robust estimate.
Fed decision
The latest decision by the U.S. Federal Reserve revealed several interesting things. There were no major surprises, but the decision nevertheless set markets on edge.
Previously, we and many others had speculated that the Fed might eventually introduce a system of yield-curve controls, but it doesn’t seem to be at the top of the agenda. The Fed is more sympathetic toward enhancing its forward guidance approach. A “soft” form of this is already arguably in effect, with the Fed committing to keep rates low until it is confident that the economy is on a path toward maximum employment.
For the first time since the arrival of COVID-19, the Fed has published new dot plot projections for the fed funds rate and updated its economic forecasts. This is what made the market nervous, as the Fed anticipates quite a slow economic recovery. Its 2020 GDP forecast of -6.5% looks superficially more optimistic than our own (-7.1%). But the methodology is different, as the Fed uses a Q4/Q4 approach rather than the usual annual average. When we convert the two forecasts into equivalent form, they are identical. To the extent we are below the consensus, that means the Fed is as well. This was hardly welcome news for financial markets.
Markets normally celebrate a dovish central bank and the Fed’s dot plots show zero appetite to raise rates in 2020 or 2021 (with only 2 out of 16 participants expecting to tighten in 2022). However, this is only because the Fed simultaneously forecasts a sluggish economic rebound. The unemployment rate is still expected to be higher than normal at the end of 2022. It is not unreasonable to claim that the Fed likely doesn’t assume a full return to economic normality until sometime in 2024.
3rd party economic forecasts
Other third-party forecasters are also still in the business of downgrading their economic forecasts.
The OECD has now updated its forecasts. It’s looking for a 7.3% decline in 2020 GDP for the U.S., and imagining a larger 8.5% decline in the event that the virus has a second peak. For Canada, the base-case forecast is -8.0%. Our own Canadian forecast is slightly worse than this, but otherwise the numbers are similar.
The World Bank has also updated its forecasts. It’s now looking for a 6.1% decline in U.S. GDP. Both sets of forecasts are below the private-sector consensus.
The private-sector consensus is itself also in motion. The latest figures in June reveal a further downgrade to a 2020 U.S. forecast of -5.6%. In fact, most major countries were subjected to a further downgrade. That said, it was not quite universal, unlike in April and May. For instance, the private-sector consensus for Canada actually edged slightly higher with the latest release, to -6.6%.
At the global level, it is remarkable how sharply the 2020 outlook has been downgraded when compared to the usual year-to-year perturbations. Simultaneously, the 2021 forecast has been revised aggressively higher (see next chart).
Consensus forecast for U.S. revised drastically as a result of COVID-19
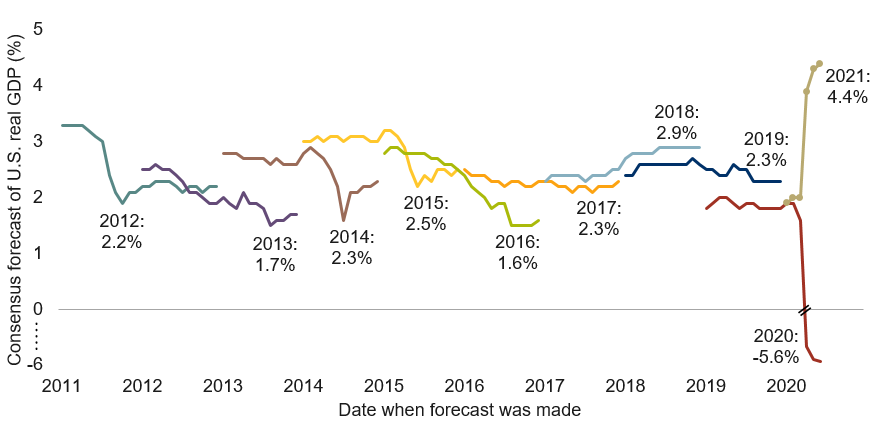
Note: As of June 2020. Source: Consensus Economics, IMF, RBC GAM
Forecast evolution
Our own forecast remains unchanged for 2020, with a 7.1% decline in the U.S. and an 8.8% drop for Canada. We continue to believe we have a decent handle on the initial peak-to-trough decline, the length of the trough, and the nature of the initial recovery.
However, we are less confident about when, exactly, economies will return to their prior peak and then eventually eliminate all accrued economic slack. If there is a risk in our view, it is that we may be too optimistic with these figures. For the U.S., we have the economy back to its prior peak at the very end of 2021 and back to its full potential by the second half of 2022. As per the updated Fed forecast, this could just as easily happen at a later date, potentially even several years later.
Getting this right is truly a tricky question. On the one hand, the global financial crisis took nine years to eliminate the last vestiges of economic slack, suggesting that a three-year timeline is much too fast for an even larger initial shock. On the other hand, the artificial origins of the shocks are such that it can theoretically be resolved unusually rapidly, much as it was lightning-quick in its arrival.
Inventories
It is important to keep tabs on how business inventories are evolving during the pandemic given any number of questions on the subject, including:
- Could supply chain problems prove especially severe during the recovery?
- Might demand be in a position to revive without necessitating higher production?
- To what extent is the COVID-19 experience mimicking past recessions?
So far, the inventory response is proving quite familiar. During recessions, one invariably sees inventory-to-sales ratios spike, and absolute inventory levels fall. This is exactly what happened this time (see chart).
U.S. inventory-to-sales ratio spiked recently
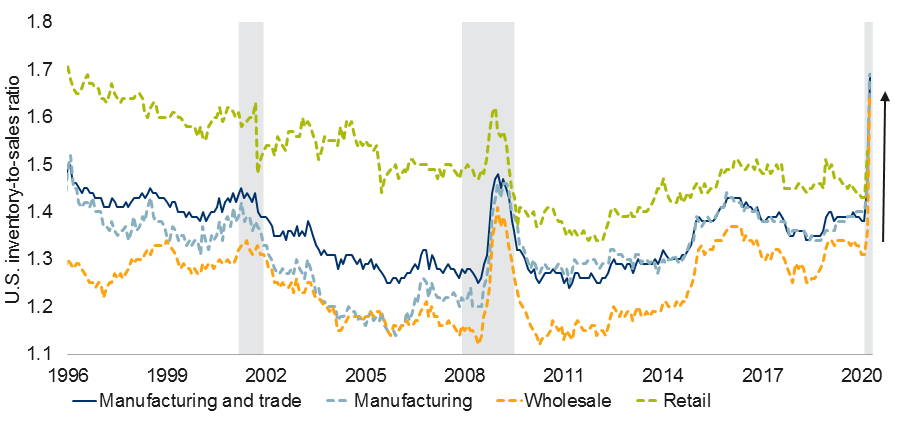
Note: Manufacturing, wholesale, and manufacturing and trade ratios as of April 2020. Retail data as of March 2020. Shaded area represents recession. Source: BEA, Haver Analytics, RBC GAM
The jump in the inventory-to-sales ratio is so abrupt because sales fell to an unprecedented degree, not because inventories are physically mounting. Absolute inventories have actually fallen modestly. This pattern is holding true in each of manufacturing, wholesale and retail.
There are surely exceptions – cases in which retailers have run completely out of inventory and other situations in which manufacturers have bulging warehouses. But overall the situation is proving quite familiar by the standard of past recessions, and unlikely to create further problems when all of this is done.
Atlantic divide
Something of an Atlantic divide has opened up with regard to how policymakers have opted to support workers during this crisis. In North America, the dominant response has been to bolster unemployment insurance programs. In Europe, it has been to put workers on paid leave, supported by government money channeled through employers.
The different approaches are visible in the unemployment figures. While the decline in economic activity has been steeper in the Eurozone and U.K., it is instead the U.S. and Canadian unemployment rates that have suffered the greatest increase. The U.S. unemployment rate rose by 11.2 percentage points between February and April, with the Canadian rate higher by 7.4 percentage points. In contrast, the U.K. unemployment rate has risen by 2.4 percentage points, the German rate is only up by 0.1 percentage point, and the Italian rate has (somewhat miraculously) declined by 3.2 percentage points over the same timeframe.
The European approach is presumably much less traumatic for workers. They remain formally employed, in some cases simply experiencing a reduction in hours spread across a company’s workers. In theory, the economic recovery can also occur more quickly to the extent that companies don’t need to go out and find new employees as demand revives. It has generally been viewed as the superior approach.
However, that is debatable. One problem with having governments subsidize company payrolls is that it is partially wasted. Some companies would have opted to continue paying their workers anyway to avoid losing them, since many workers possess specialized knowledge that is difficult to replace. This approach can also allow zombie companies to persist – ones in which there is little realistic prospect of revival in the future. In such cases, those workers might be better off actively pivoting toward industries capable of future growth.
It is also possible for companies to take advantage of such government programs. France, for instance, has now spent 24 billion euros over just two months on a support program that is subsidizing more than half of the country’s private-sector workforce. To the extent no country without such programs has come close to laying off half of its workforce, this is probably overkill and may become very expensive if the programs fail to cleanly wean companies from the public funds as their economies attempt to revive.
To be clear, the point is not that the North American approach is superior, but rather that the European version also has warts.
In evaluating which approach is best, it is also worth recognizing that each region was operating within its own special constraints. U.S. laws have made the country’s labour market famously flexible, rendering an unemployment insurance-based approach the natural choice. Conversely, Europe has a long history of cutting hours rather than workers during downturns, making a solution along these lines logical.
Furthermore, it is an exaggeration to claim that each region pursued a completely different strategy. Some people did lose their jobs in many European countries, and both the U.S. and Canada did introduce their own more limited forms of wage subsidies, albeit with a low uptake.
In the end, it is even debatable how much harder it will actually be for companies to re-hire previously laid off workers. In the U.S., the newly unemployed report very high attachment levels to their prior employer, suggesting the scope for reunification later.
Perhaps the main point in all of this is that – thus far – neither approach has been clearly better. The greater economic damage in Europe is mostly a function of more aggressive quarantining as opposed to the policy supports introduced. It is possible that Europe will manage a faster recovery by virtue of its approach, but this is far from evident in the data so far.
Stimulus expiry risk
There are various ways this nascent economic recovery could be undermined. Obvious risks include the prospect that the virus returns in force, the potential for second-round economic damage, and the fact that a chunk of the fiscal stimulus currently keeping economies afloat is scheduled to expire in the coming months.
The one-time U.S. Economic Impact Payments began to be delivered in mid-April. About 70% of the $1,200 per individual was received by the end of the month. While the remainder will apparently take months to trickle forth, it is fair to say that this program has already passed its peak, and as such U.S. household income in May is unlikely to be a robust as it was in April. This will understandably limit consumer spending.
Most other programs don’t expire until somewhat later, and many may yet be extended. Here is the timing:
- Expanded unemployment benefits in the U.S., providing an extra $600/week on top of regular state benefits, are set to expire after July 31, 2020. Democrats wish to extend it, but this seems unlikely as Republicans are opposed.
- The Canada Emergency Response Benefit of $500 per week has a maximum duration of 16 weeks, meaning some people will begin to lose eligibility in early July. The Liberals have proposed extending this to 28 weeks, but the proposal has not yet passed.
- The Canada Emergency Wage Subsidy was initially scheduled to expire on June 6, but has now been extended to August 29.
- France plans to begin phasing out its primary subsidy program over the next few months.
- Germany has just extended its main program from an already long 12 months to 21 months, so there is little near-term danger there.
- The main U.K. program was just extended from June until October, with a gradation that will require businesses to pay an ever-higher share of worker wages as time passes.
It is a difficult balancing act for governments. They naturally wish to provide support for as long as needed. But they must equally balance their fiscal capacity and the fact that many workers are dissuaded from returning to work so long as generous government support is available. One mini-fiscal cliff has already resulted (in the U.S.), and more are possible.
U.S. election preview
The U.S. presidential election this fall is now officially between President Trump and Democrat candidate Biden (see next chart). In many ways, Biden was an improbable candidate for the Democratic Party, lagging badly in the polls well into the primary battle. But as the far-left candidates split the vote and a more diverse electorate began to make its voice known, he ultimately emerged victorious.
Biden now leads Trump in 2020 U.S. presidential election
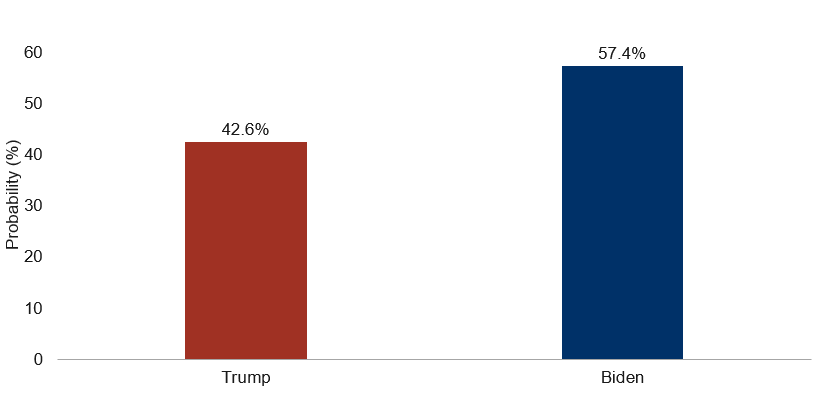
Note: As of 06/14/2020. Source: PredictIt, RBC GAM
The Biden strategy has mostly involved laying low over the past several months. Whether this is out of a sense of propriety given the recession and pandemic unfolding, or simply because he recognizes this election is a referendum on Trump and Biden’s tendency toward gaffes means he is best kept out of the limelight, is unclear. It is likely a combination of the two. Biden also has the impediment of a long history of Senate votes, some of which don’t stand up to modern-day scrutiny.
Biden’s policy positions were pulled somewhat toward the left during the primaries given the far-left nature of his Democratic opponents. He has since pivoted somewhat further to the left in an effort to rally the full party behind him. This is an unconventional pivot, as normally politicians shift toward the centre in the lead-up to the general election. There is a growing expectation that Biden may announce a minority female running mate, further enthusing the Democratic base.
For the moment, betting markets believe Biden has the upper hand, with a 57% chance of victory (see next chart). The prior Republican President, George W. Bush, has indicated he will not campaign for Trump. While there tends to be a huge incumbency advantage and the president’s base has been rock-solid over the past four years, the administration’s handling of COVID-19 may have alienated him with vulnerable seniors. His stance on recent anti-racism protests has put him on the opposite side of the issue to the great majority of Americans. Conversely, the Democrat base has apparently enjoyed a significant influx of funds and volunteers in recent weeks.
Biden now leads Trump in 2020 U.S. presidential election
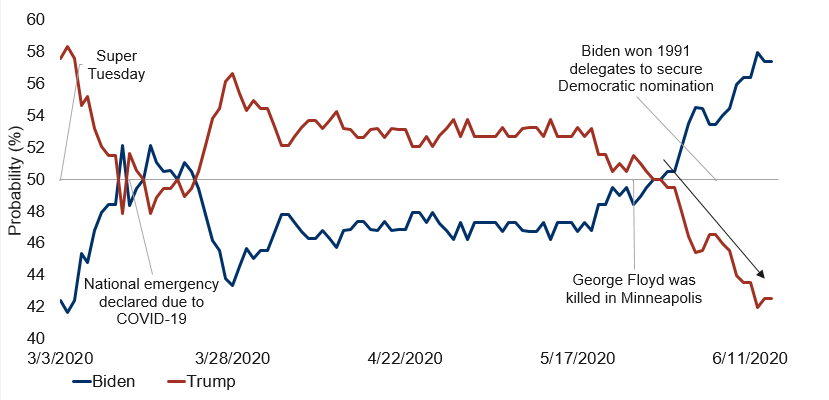
Note: As of 06/14/2020. Based on prediction markets data and RBC GAM calculations. Source: PredictIt, RBC GAM
Of course, there remains plenty of time for all of this to change. There are still 4.5 months until the election. A successful economic recovery would favour Trump, whereas a double-dip would favour Biden. COVID-19 has been so politicized in the U.S. that being cautious about COVID-19 is increasingly viewed as a Democratic attribute, while pushing to maximize short-term economic output is viewed as a Republican one. One fascinating poll revealed that only 26% of people who regularly wear masks are Trump supporters, while 83% of those who generally don’t wear masks support the President.
For that matter, Trump went into the 2016 election with no better than a 40% chance of winning, and nevertheless emerged victorious. The race isn’t over yet.
But suffice it to say that current tracking points toward the prospect of a Democratic president, and further highlights the real risk that the Senate could also flip toward the Democrats. The House of Representatives is already firmly in Democrat hands. Whether a Democratic sweep would represent a cause for celebration or for consternation is a matter of personal political stripe. But there is reason to think that financial markets might be nervous about the prospect of tax hikes under an empowered Democratic administration. This may become a more relevant consideration for financial markets as the election approaches.
-With contributions from Vivien Lee and Graeme Saunders
Interested in more insights from Eric Lascelles and other RBC GAM thought leaders? Read more insights now.