Monthly webcast
Our economic webcast for February is now available, entitled “New virus variant versus vaccines.”
Overview
Super Bowl hangovers notwithstanding, the past week has arguably yielded more positives than negatives. Positives include:
- COVID-19 infections, fatalities and hospitalizations are all falling sharply.
- Significant vaccination progress continues to be made.
- The U.S. economy is looking pretty good in early 2021, with some upside fiscal stimulus risk.
- Our U.S. business cycle work delivers a strong “early cycle” diagnosis.
Conversely, negatives include:
- The rate of vaccination continues to proceed somewhat more slowly than desired at the global level, and significantly more slowly than hoped-for in certain countries, including Canada.
- The new South African variant is proving resistant to vaccines.
COVID update
At the global level, COVID-19 infections have staged a remarkable 43% retreat over the past month (see next chart). Global fatalities are also somewhat improved.
Global COVID-19 cases and deaths

As of 02/07/2021. 7-day moving average of daily new cases and new deaths. Source: WHO, Macrobond, RBC GAM
Emerging market nations have managed a steady, significant improvement. But it is developed countries that have improved most sharply (see next chart).
COVID-19 emerging market and developed market infections

As of 02/07/2021. Calculated as the 7-day moving average of daily infections. Source: WHO, Macrobond, RBC GAM
These improvements are not restricted to a small number of countries. The pattern is extremely broadly based, as demonstrated by the number of countries recording transmission rates below the critical threshold of one (see next chart). Only Iran and France register as suffering slightly rising infection numbers.
Transmission rate over one means COVID-19 accelerating

As of 02/07/2021. Transmission rate calculated as a 7-day change of underlying 7-day moving average smoothed by a 14-day moving average of new daily cases. Source: WHO, Macrobond, RBC GAM
Substantial improvements
Among the key countries we focus on, the U.S. has cut its daily infection rate by a whopping 53% since its January 7 peak. It is now achieving the lowest daily rate since November 12 (see next chart). The country’s fatality numbers have not yet declined, but should begin a precipitous fall of their own over the coming weeks given the normal lag to infections.
COVID-19 cases and deaths in the U.S.

As of 02/07/2021. 7-day moving average of daily new cases and new deaths. Source: WHO, Macrobond, RBC GAM
The Canadian story is quite similar. Canada has slashed its daily infection rate by 57% since its January 9 peak, declining to the slowest clip since November 10 (see next chart). Canada’s fatality numbers are already in decline.
COVID-19 cases and deaths in Canada

As of 02/07/2021. 7-day moving average of daily new cases and new deaths. Source: WHO, Macrobond, RBC GAM
The U.K. has managed an even sharper 69% decline in its daily infections, despite simultaneously grappling with a more contagious variant (see next chart). However, given the extreme acceleration of the U.K. pandemic in late 2020, the improvement has only managed to return the infection rate to the level of December 15. Hopefully further progress is ahead, though the rate of improvement may be decelerating slightly.
COVID-19 cases and deaths in the U.K.

As of 02/07/2021. 7-day moving average of daily new cases and new deaths. Source: WHO, Macrobond, RBC GAM
Fatality math
A bit of back-of-the-envelope math reveals just how quickly fatalities can be expected to decline over the coming month or two. There are two drivers for this anticipated improvement:
- Using the U.K. as an example, the country’s infection rate has already fallen by 69% from its peak. It might reasonably be expected to be 75% lower within a matter of days. Let us call this a four-fold reduction in the rate of infection.
- The U.K. is among the leading nations in its inoculation efforts. The U.K. will have inoculated its highest-risk residents with their first jab within the next few weeks. Estimates vary, but a single dose is thought to provide something like 70% protection. To the extent that this vulnerable group is responsible for more than 80% of all COVID-19 deaths, the COVID-19 fatality rate per infection should fall by around 56% over the next month.
Combined with the country’s lower infection rate, this argues for a literal tenfold decline in U.K. fatalities. Whereas the U.K. recently suffered more than 1,200 deaths each day from COVID-19, this could become just 120 per day by the start of March. Furthermore, the fatality trend should continue downward from there, to the extent that:
- the infection numbers continue to improve (the momentum supports this, though it is not certain)
- the inoculations continue to roll out (extremely likely).
Still waiting on Israel
Israel continues to win the inoculation race – discussed later – but its infection figures have yet to significantly respond. In fact, the country even suffered a temporary infection spike over the past week. We discussed several possible reasons for this in last week’s note.
COVID-19 cases and deaths in Israel

As of 02/07/2021. 7-day moving average of daily new cases and new deaths. Source: WHO, Macrobond, RBC GAM
Fortunately, Israel’s fatality numbers are now seemingly beginning to respond. This makes sense, as the decline in fatalities should be much sharper than the decline in infections given the way that candidates for vaccination are prioritized. It should be emphasized that more granular studies confirm that Israelis who have been inoculated are far less likely to be infected or hospitalized than normal, so this is not a function of vaccines failing.
Risk of future infection waves
With COVID-19 infections in retreat nearly everywhere, it is tempting to declare victory over the virus. The improving trend is a wonderful development, but it is important to recognize that future waves are still possible. There are three major risks and one minor one:
- The new, more transmissible virus variants will probably eventually take over the world. This could certainly allow the infection numbers to soar again. It could even partially undermine the progress of vaccinating, to the extent that the South African variant is proving resistant to some vaccines. But let us not forget that the U.K. and South Africa have nevertheless managed to control the variants in the end.
- Economies are now beginning to reopen. So far, the changes have been limited and are unlikely to spark the virus. But politicians are under great pressure to further normalize business activity. There is a distinct risk that the reopening from here happens with too much enthusiasm, resulting in another virus wave and necessitating later lockdowns.
- It remains possible – though far from proved – that part of the recent improvement in the COVID-19 infection rate is due to seasonal effects. Rather than winter representing the ideal environment for virus transmission, it could be that the fall and spring are actually the period of maximum transmission. That was seemingly the case with the Spanish Flu, and indeed the two spikes of COVID-19 so far have coincided with the spring and autumn of 2020. If this isn’t just a coincidence, the virus could become more difficult to manage over the next few months.
- Arguably a much more minor consideration, socializing due to the recent Super Bowl in the U.S. and the imminent Lunar New Year across much of Asia could temporarily accelerate the virus over the coming month, much as Christmas may have supercharged infections in late December and early January.
Of course, the ever-broadening vaccine rollout should ultimately vanquish any of these risks that might temporarily manifest. But the fact remains that the infection numbers could well re-accelerate for a period of time over the next few months.
Countries start to reopen
Taking their cue from falling COVID-19 infection, fatality and hospitalization numbers, some jurisdictions are starting to reopen. We believe countries are keying off of the hospitalization rate more than anything else. Indeed, a Quebec official recently acknowledged that the province can handle four to six times more infections without impacting hospitals after older people are immunized. Hospital capacity was central to the lockdown decision late last fall, and is likely to be central to reopening plans.
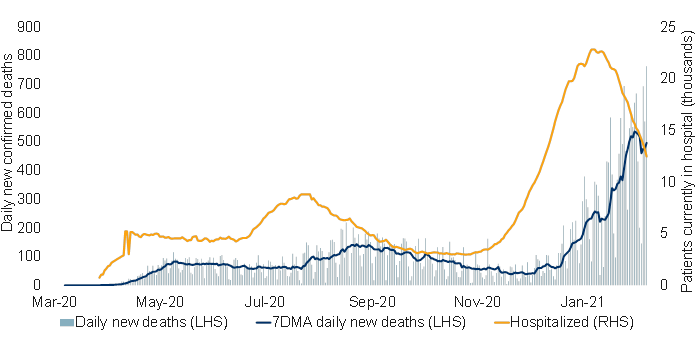
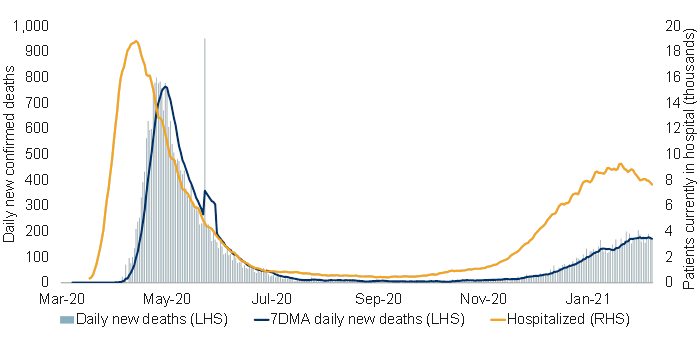
In the U.S., the hospitalization figures are already improving substantially. California hospitalizations are already down by more than 40% (see next chart). The improvement is also significant in Florida and Texas. The improvement is more tentative in New York State, but also genuine (see subsequent chart).
State of California
As of 02/07/2021. 7-day moving average of daily new deaths used as trend line. Source: The COVID Tracking Project, Macrobond, RBC GAM
State of New York
As of 02/07/2021. 7-day moving average of daily new deaths used as trend line. Source: The COVID Tracking Project, Macrobond, RBC GAM
The tentative reopening is not yet visible in our global stringency index (see next chart). However, the rules have certainly changed in a number of jurisdictions.
Global Stringency Index

As of 02/07/2021. Global Stringency Index measuring the strictness of lockdown policies that restrict mobility, calculated as stringency index of 50 target economies. Source: University of Oxford, IMF, Macrobond, RBC GAM
In the U.S., California’s stay-at-home order expired on January 25. Massachusetts recently increased the permitted capacity of its restaurants and gyms. President Biden has pledged to reopen most elementary and middle schools in his first 100 days of office.
In Canada, Alberta and Quebec have already reopened their schools, with other provinces now doing the same. Quebec has re-opened non-essential stores, barber shops and museums. Outdoor activities are now permitted with up to three people from other households.
While the trend is seemingly back toward reopening, it is important not to proceed too quickly. The daily infection rate is still undesirably high in many countries, even if the trend is encouraging.
In contrast to all of this, many countries are beginning to lock down more aggressively than before in one important way. This is with regard to international travel. Given terror over the spread of more transmissible (and partially vaccine-resistant) virus variants, many countries are limiting cross-border travel more strictly than before.
Vaccination progress
More than 119 million vaccine shots have now been administered globally, an increase of roughly 20% over the past week alone. Sixty-seven countries have now begun their vaccine campaigns.
Israel continues to lead the way, with an admirable 62.8 shots administered per 100 people (see next chart). Recall that to the extent most vaccines require two doses, this still leaves the country less than half of the way to inoculating all of its citizens, though conceivably not much short of halfway to herd immunity.
Cumulative doses administered by country

As of 01/27/2021. Cumulative total doses administered by country per 100 people. Source: Our World in Data, Macrobond, RBC GAM
The U.K. and the U.S. continue to outpace most other developed nations, with 18.4 and 11.6 jabs per 100 people, respectively. This represents significant progress relative to a week ago (see next chart).
Coronavirus vaccine doses administered

As of 02/07/2021. 7-day moving average number of new daily coronavirus vaccine doses administered per million. Source: Our World in Data, Macrobond, RBC GAM
Europe continues to lag those two countries, though it is making significant progress. The largest members are managing 3-4 cumulative doses per 100 people. Canada, conversely, continues to lag the rest, with just 2.8 doses per 100 people.
New vaccines
It has been a good few weeks for new vaccines. Two weeks ago saw the announcement of the successful Johnson & Johnson and Novavax vaccines. Last week then saw positive results for Russia’s Sputnik vaccine.
If it feels like you’ve already heard about Russia’s vaccine, it is because the country prematurely announced the vaccine last summer after minimal testing. Fortunately, the subsequent testing has endorsed the initial claims, with a reported 92% efficacy rate against symptomatic COVID-19 – in line with the best vaccines. It was reported to be 100% effective against severe and moderate cases – an impressive outcome.
It should be noted that Russia has arguably jumped the gun a second time since it still isn’t actually done testing, having tested 20,000 out of a targeted 40,000 people. Nevertheless, the vaccine will presumably join the others within the next few months, probably with a greater orientation toward emerging nations.
Mutation worries
As we have been flagging for several weeks, while none of the new virus variants are in the least bit welcome, the South African strain is the most concerning. Not only is it more transmissible and potentially more deadly than the original virus, but it seems significantly resistant to the existing vaccines. All major vaccine makers have acknowledged diminished efficacy against the variant.
Particularly concerning is a new study of the AstraZeneca vaccine, which concludes that the vaccine does not offer protection against the mild or moderate forms of the South African variant. It is apparently too early to judge whether it stops the most severe instances of the disease, hospitalizations or deaths. For the moment, South Africa has understandably opted to pause its rollout of the AstraZeneca vaccine.
Moderna plans to produce a booster shot to address the lower efficacy rate. Pfizer argues no new booster is needed for its particular vaccine. Most claim they can alter the vaccine itself, if needed, but that would presumably require additional months of testing.
The latest on vaccine nationalism
Vaccine nationalism remains a worrying threat with regard to how vaccines are being disbursed. Prominently among these, the EU has now put in place export controls. This permits the bloc to theoretically halt the export of vaccines, and also to better track where vaccines are going. The EU has specifically threatened to block the export of AstraZeneca vaccines to the U.K. after its own supply was cut.
While Canada does not appear to be the target, this could theoretically limit Canada’s supply of vaccines as well. The EU trade commissioner has apparently assured Canadian politicians that the new rule will not be used against Canada, but it is concerning that Canada is not on a list of 120 exempt nations.
Elsewhere, surprisingly little attention has been directed to U.S. vaccine nationalism. A debate still rages whether a recent Trump executive order and/or the country’s Defense Production Act are technically capable of limiting vaccine exports. So far, the proof is in the pudding: no COVID-19 vaccines are leaving the U.S. at the moment. It says a great deal that Canada is being supplied by European plants rather than the U.S. plants that are just across the border. And it is not merely a matter of the vaccine makers needing to ensure the U.S. doesn’t lag behind others: EU inoculations have been running three times slower than in the U.S. on a per capita basis, and yet it is the European plants that are having to share their supply.
Lastly, a bit of unwinding vaccine nationalism: India is now exporting a portion of the vaccines it is producing, having earlier planned to use them exclusively domestically for the first part of 2021.
On what basis are vaccines being allocated?
It remains somewhat of a mystery how vaccine makers are opting to distribute their precious vaccines. We can think of six prime considerations. None perfectly explains the allocation process and most are plagued by contradictions. But collectively they probably capture most of the underlying logic.
- The vaccines appear to be distributed in part on the basis of the number of doses ordered per capita. We can see this in that the U.S. and U.K. are number two and three on the list of how many doses were ordered relative to their population, and indeed they are among the countries receiving the most vaccines per capita. But this filter doesn’t work perfectly since Canada has ordered by far the most vaccines per capita and yet is lagging badly. Furthermore, Israel has ordered surprisingly few vaccines per capita, and yet is miles ahead in its supply of vaccines.
- The nationality of the vaccine developers and the location of the manufacturing plants appear to influence vaccine distribution. To the extent the dominant vaccine makers so far are primarily American, European, British and Chinese – and most factories are located similarly – it makes sense that these countries are receiving a disproportionate number of doses. Israel and a few Middle Eastern nations represent curious exceptions to this rule.
- It appears to matter when each country ordered its doses. AstraZeneca publicly revealed this when it explained that the EU was receiving fewer doses on a per capita basis than the U.K. because the EU had submitted its order three months later. This appears to help explain Canada’s underperformance since Canada submitted its orders late after having been delayed by a plan to procure Chinese vaccines that eventually failed (possibly over ongoing frictions between the two nations). However, this is far from the only factor considered by vaccine makers, since Israel did not finalize its order with Pfizer until mid-November whereas Canada had submitted its order at the beginning of August.
- It may matter how much each country paid for each inoculation. This isn’t publicly known, and so it is unclear how it is affecting distribution. It was leaked that South Africa paid considerably more for its AstraZeneca vaccines than did some earlier countries, though the company has retorted that the earlier countries had actively helped to fund the development of the vaccine in addition to their orders, whereas South Africa was merely a customer. Pricing is unlikely to play a central role.
- Geopolitical considerations may also apply. It is notable that big, powerful countries like the U.S. and U.K. are near the top of the inoculation leader board. Most developing countries are lagging significantly. Companies cannot afford to make enemies of the biggest nations. As recently demonstrated, Canada suffered a sharper supply cut than Europe in response to recent production struggles. Israel can be reconciled in part because it has long enjoyed a position of outsized geopolitical prominence relative to its size, and in part because the Israeli Prime Minister was apparently extremely persuasive in the 13 phone calls he made to the Pfizer CEO – a massive political push. On the other hand, it can’t only be about global geopolitical standing as the United Arab Emirates has secured far more than most countries as well.
- Finally, it presumably matters what clauses countries negotiated into their contracts with the vaccine makers. For instance, the U.S. apparently negotiated an exclusivity deal with Pfizer and Moderna, meaning that the initial doses produced in the U.S. will be exclusively for Americans. Conversely, the EU only managed to negotiate a “best effort” clause into its contract with AstraZeneca, and seemingly was unable to limit exports from its domestic facilities. It is, of course, unclear the extent to which the U.S. was simply a savvier negotiator versus having more clout to extract such demands given its status as the home jurisdiction for many of the vaccine makers. For its part, Israel appears to have promised vaccine makers access to detailed medical data about the recipients of the jabs.
We have no way of knowing which of the variables is the most important, and which the least. For that matter, we cannot even reliably measure such things as geopolitical considerations, and we are not privy to other explanatory variables such as the nature of the contracts signed.
One thing is certain: Canada is lagging badly in its vaccination efforts. The most likely three reasons are:
- a lack of domestic production capacity
- the lateness of the country’s orders
- a lack of political clout.
It is impossible to say whether the contract was well-negotiated or not (and the extent to which this was influenced by the prior reasons).
Based on the federal government’s claims, it appears that the country is still thought to be on track to receive its agreed-upon allotment of doses by the end of the first and second quarters, despite a slower-than-planned start to the first quarter.
Somewhat ominously, The Economist magazine now predicts that Canada will achieve widespread vaccine coverage by mid-2022, after the late-2021 timing it assigns to the U.S. and Western Europe. We are somewhat more optimistic than The Economist on the rate of inoculation for all of these countries. But we cannot deny the risk to the Canadian outlook, particularly if the EU were to start playing hardball with its domestic producers.
Economic developments
A surprisingly good end to 2020
The close of 2020 was not exactly a good time for the economy. The second wave was beginning to do economic damage. But it is nevertheless proving to have been a bit less damaging than initially feared.
In the Eurozone, fourth-quarter GDP was recently reported at -0.7% (non-annualized), moderately better than the consensus forecast. When compared to the giant 11.7% decline in the second quarter and the 3.7% drop in the first quarter, it appears that the economic punishment from the second wave was less than one-tenth the damage of last spring.
Recall that U.S. fourth-quarter GDP rose by 4% annualized. That’s a solid performance, albeit representing a deceleration from the prior quarter. Canada appears to have avoided economic decline at the end of 2020 as well, with monthly gains announced for both November and December. This tentatively adds up to around an 8% annualized GDP gain in the fourth quarter.
Of course, the second wave damage was somewhat more back-loaded in North America, meaning we need to be on guard for damage over the first few months of 2021 as well.
U.S. payrolls revert to positive
Happily, and in contrast to the loss of 227K positions in the final month of 2020, January brought the net addition of 49K jobs to the U.S. economy. This is still underwhelming by normal standards (simple population growth requires closer to 100K new workers each month). But it is good to be back on the positive side of the ledger.
The less reliable (and less closely-watched) household survey rose by a solid 201K, after avoiding a decline the month before as well. The unemployment rate fell from 6.7% to 6.3% and the underemployment rate declined from 11.7% to 11.1%.
Given that U.S. weekly jobless claims are again improving in late January after a rough first part of the month, it stands to reason that February job creation should be somewhat improved again.
Elsewhere among U.S. data releases, the Institute for Supply Management (ISM) Services Purchasing Managers’ Index (PMI) for January managed not just to remain at an elevated level, but to advance somewhat further – from 57.2 to 58.7. It would appear that the U.S. economy was still growing in early 2021. From there, the growth rate is more likely to accelerate than slow given the combination of major fiscal stimulus, a fast vaccination clip and improving virus numbers.
Canadian job numbers
In contrast to the U.S, Canada shed jobs for a second consecutive month, losing a big 213K positions in January. With the usual disclaimer that Canada’s job numbers are notoriously vulnerable, this suggests the Canadian economy suffered more damage from the second virus wave than the U.S. This arguably makes sense, as Canada appears to have locked down more than the U.S. over the time period. A silver lining is that the country managed to add 13K full-time jobs, though of course this means it shed even more part-time jobs than reflected in the headline figure.
Canada’s unemployment rate rose from 8.8% to 9.4%. It is now more than 3 percentage points behind the U.S. It is normal for the Canadian rate to be about 2 percentage points higher than the U.S. for a mix of reasons and factors related to greater seasonal employment. But even with this recalibration, Canada is now behind the U.S. in the country’s labour market progress.
Interestingly, other January economic data for Canada was not bad. Two of the three monthly leading indicators we track rose during the month, and two of the three are at levels consistent with economic growth. We thus flag the risk that the Canadian economy shrank in January (particularly given that it somehow managed to defy decline in December), but it is not a certain outcome. Our base-case forecast assumes a slightly negative first-quarter GDP print as well.
Saving commuting time
A recent study attempted to calculate the time saved in the U.S. due to the elimination of the daily commute for those working from home due to the pandemic. The amount of time saved was staggering: more than 9 billion hours between March and September alone. But it was a bit depressing how people used their extra time. Fully 43% of the spare hours were dedicated toward working more, another 27% was allocated toward greater childcare and chores, and just 30% went toward greater leisure and exercise. As an economist, I suppose I should be happy that economic output was a bit larger due to the extra work people put in, but as a human, I’m not!
Business cycle update
Each quarter, we go through a process of updating our U.S. business cycle scorecard as a means of gauging the state of the business cycle in a rigorous way. After the scorecard diagnosed a recession in mid-2020 and then pivoted toward a mix of “Start of cycle” and “Early cycle” at the close of 2020, the latest such effort now yields a firm assessment of “Early cycle” (see next table).
U.S. business cycle scorecard

As at 02/03/2021. Darkness of shading indicates the weight given to each input for each phase of the business cycle. Source: RBC GAM
Interestingly, the second-most plausible position of the business cycle is now “Mid cycle”, though this lags far behind “Early cycle” and only nudges past “Start of cycle”. Meanwhile, the “Recession” category has faded into the background, coming a distant fourth (see next chart).
U.S. business cycle score

As at 02/03/2021. Calculated via scorecard technique by RBC GAM. Source: RBC GAM
In fairness, these results aren’t exactly a surprise. If you’d asked me beforehand, I would have guessed “Early cycle.” But it is nevertheless useful to confirm this via an empirical framework.
Among some of the more interesting charts, private investment as a share of GDP is soaring, much as it usually does during the early phase of the business cycle (see next chart). The same goes for the rise in temporary employment (see subsequent chart). Finally, the fact that the output gap is actively closing and yet has ample room for further improvement makes the case for either an “Early cycle” or a “Mid cycle” diagnosis (see third chart).
Good gauge of late cycle: private investment/GDP

As of Q4 2020. Shaded area represents recession. Source: BEA, Haver Analytics, RBC GAM
U.S. temporary employment share declined dramatically, recently recovering

As of Dec 2020. Shaded area represents recession. Source: BLS, Macrobond, RBC GAM
Still considerable room for catch-up growth in coming years

As of Q4 2020. Shaded area represents recession. Source: CBO, Macrobond, RBC GAM
Political update
Non-U.S. developments
In Italy, the former head of the European Central Bank – Mario Draghi – has been asked to form a national unity government after the prior coalition crumbled. Based on reports, this seems fairly likely to happen. What does this mean? Given his history of deploying massive economic stimulus, it is entirely possible he will opt to deliver major fiscal stimulus in Italy.
Fortunately, he is someone who understands the significance of accumulating too much debt and the consequences of printing money indefinitely, and so this is unlikely to be pursued to an unsustainable degree. He is, of course, also pro-Europe. In many ways, a Prime Minister Draghi would likely function in a similar fashion to how Janet Yellen is now operating in the U.S. as Treasury Secretary.
As an aside for Canadian readers, Draghi’s potential term as Prime Minister should elicit more than just casual interest, since it could well prove a prophecy for our own political future. With former Bank of Canada and Bank of England governor Mark Carney not just back in Canada but stationed in Ottawa and apparently possessing previously reported political aspirations, it could well be that Canada eventually has an economist-turned-politician of its own.
Among the various political events of relevance for 2021, Germany arguably merits considerable attention. Merkel is expected to step down as German Chancellor, and the recent breakdown of Germany’s longstanding grand coalition injects an element of uncertainty into the political stance of Europe’s most important nation.
U.S. fiscal stimulus update
The U.S. Senate has now approved a measure that will permit the proposed Biden stimulus plan to be approved using the Reconciliation process in the Senate. This means just 51 votes in the Senate are needed, versus the usual 60. That happens to be precisely how many votes the Democrats possess.
While we had already expected another round of U.S. fiscal stimulus, this further increases the probability, and perhaps also the size. We formally forecast a $1 trillion fiscal package, but it could now conceivably be somewhat larger, if not the full $1.9 trillion Biden has pitched.
The International Monetary Fund (IMF) recently estimated that, if delivered in its entirety, the plan could boost the U.S. economy by around 5% over three years – quite a significant upgrade. However, tilting the stimulus so heavily toward lump-sum cheques is not the most efficient approach, as conveyed by a Penn-Warton Budget Model. The model that argues households would save 73% of any money they receive in direct payments.
Of course, when the prior round of fiscal stimulus expired in 2020, some of the money that had initially been saved was then deployed, boosting the effectiveness of the program somewhat. That could yet boost the yield here, too.
Biden policy, more generally
The following table summarizes some of the key recent deliverables from the Biden administration, and also our expectations for the future across nine major policy categories (see next table).
Some details on the Biden Blue Wave agenda

As at 01/28/2021. Source: RBC GAM
From a Canadian perspective, we have long argued that Biden is probably more economically positive than negative. But this is certainly not without exceptions, as per the recent cancellation of the Keystone XL pipeline. Here is a broader overview of the main macroeconomic pros and cons for Canada (see next table).
Canadian implications from the U.S. election – arguably more good than bad

As at 01/28/2021. RBC GAM
Lastly, and in line with our expectations, it appears highly unlikely that President Trump will be convicted in his Senate impeachment trial. Only five Republicans in the Senate appear likely to support the Democrat initiative, which is well short of the 16 Republicans needed. It still seems technically possible, if legally dubious, for Trump to be banned from holding future public office, however.
-With contributions from Vivien Lee and Sean Swift
Interested in more insights from Eric Lascelles and other RBC GAM thought leaders? Read more insights now.