{{r.fundCode}} {{r.fundName}} {{r.series}} {{r.assetClass}}

You are currently viewing the Canadian website. You can change your location here.

Terms and conditions for Canada

Welcome to the new RBC iShares digital experience.

Find all things ETFs here: investment strategies, products, insights and more.

.hero-subtitle{ width: 80%; } .hero-energy-lines { } @media (max-width: 575.98px) { .hero-energy-lines { background-size: 300% auto; } }

What do we mean by social infrastructure? The RBC Emerging Markets Equity team defines social infrastructure as essential public assets and services that support people’s daily lives and have a significant influence on their standard of living. Within this definition we include education, healthcare, housing, public transport, water & waste management, and renewable energy.

Rapid urbanization is creating unprecedented demand for infrastructure assets in emerging markets (EM). At the same time, historic underinvestment has led to significant shortfalls in the quality and quantity of infrastructure in EM. This growing supply/demand mismatch has put pressure on fundamental social assets such as education, healthcare and housing, which has negatively impacted the quality of life for people in urban areas. Poor social infrastructure has contributed to problems such as rising congestion levels, increased crime, housing shortages and pollution. The current COVID-19 pandemic has further exacerbated the situation and has highlighted the lack of healthcare equipment and provision globally.

The pandemic has impacted both developed and emerging markets, but the lack of basic social infrastructure in some parts of EM has made the situation particularly dire. As shown in Exhibits 1 and 2, EM countries lag developed markets (DM) in the quality of overall infrastructure particularly in areas such as healthcare.

Exhibit 1: Quality of overall structure

Exhibit 1: Quality of overall structure

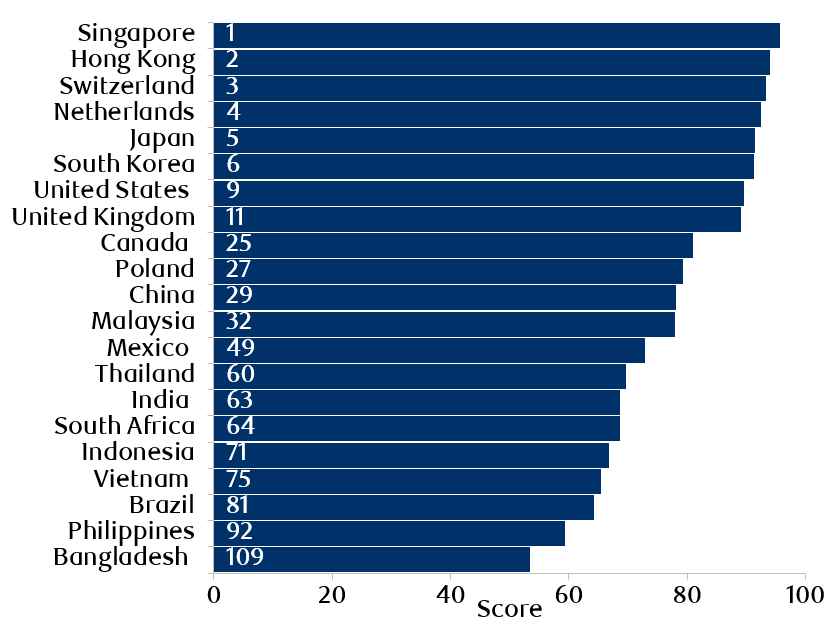
Source: The Global Competitiveness Report, World Economic Forum. Data as at October, 2018. The Infrastructure pillar of the Global Competitiveness Index 4.0 assesses the quality and extension of transport infrastructure (road, rail, water and air) and utility infrastructure (electricity and water).

Exhibit 2: Underinvestment in social infrastructure has led to shortages in EM (Healthcare example)

Exhibit 2: Underinvestment in social infrastructure has led to shortages in EM (Healthcare example)

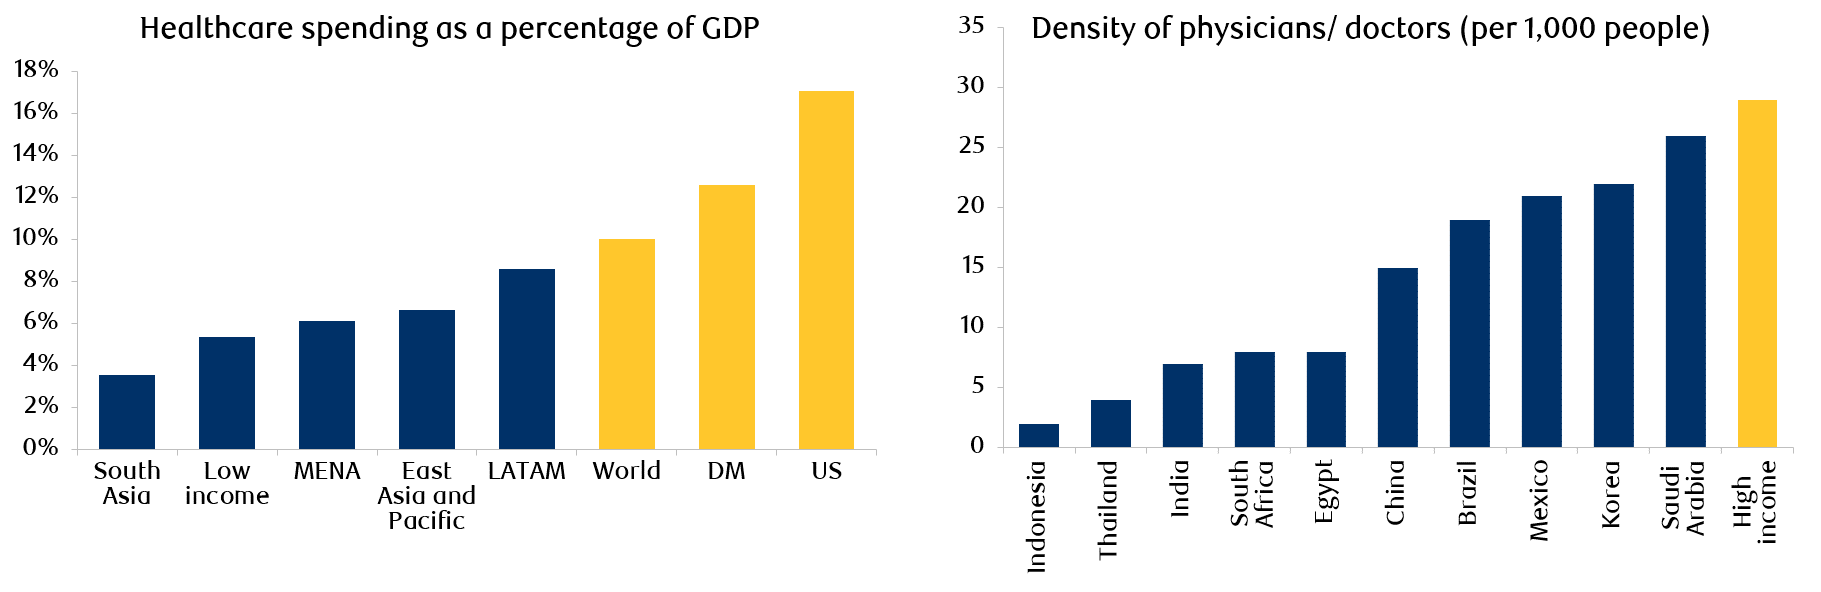
Source: LHG: World Health Organization, World Economic Outlook, UBS, April 2018. Underlying data as of 2016. Source: World Bank. Data as at July, 2019. Data collected from 2010-2015.

Investing in social infrastructure, both in the form of new investment as well as to maintain existing assets, is therefore critical in order to resolve the many challenges created by rapid urbanization and to ensure the sustainable growth of cities going forward.

Social infrastructure also brings long-term economic benefits and is positively correlated to the development of a country. For example, Exhibit 3 shows a strong link between the quality of education in a country and its productivity. A similar relationship can be found between other social infrastructure assets and economic measures, such as public healthcare expenditure and economic growth.1

Exhibit 3: Relationship between labour productivity and quality of primary education

Exhibit 3: Relationship between labour productivity and quality of primary education

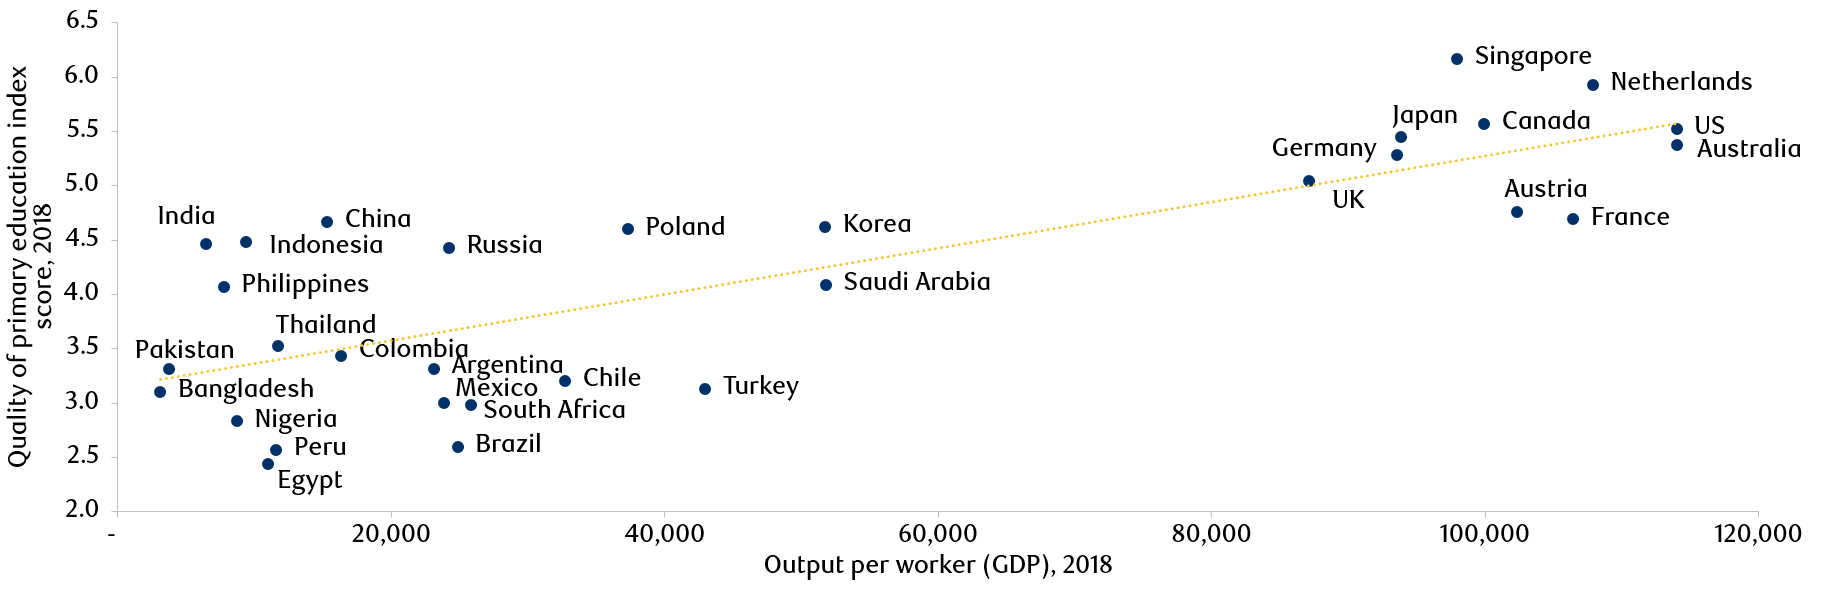
Source: Global Competitiveness Index and International Labour Organization (ILO), ILOSTAT. Data as at December, 2019. Note: Quality of Primary Education Index of the Global Competiveness Index.

Can the social infrastructure opportunity be realized in EM?

It is important to ask ourselves whether EM governments have the political desire and ability to address the shortfalls in social infrastructure, particularly considering the ongoing and extensive government stimulus programs launched in response to the current COVID-19 pandemic.

Globally, governments have committed over US$8tn to fight COVID-19 and to revive their economies. The key concern with the fiscal stimulus in EM has been the government debt backdrop. Although we are likely to see a deterioration in fiscal deficits in some countries, overall, EM have more favourable fiscal positions than DM. Furthermore, although government debt will inevitably increase in EM, the debt still appears manageable at these levels which we believe bodes well for future social infrastructure investment in the region (Exhibit 4).

Exhibit 4: Fiscal deficits & Government Debt / GDP in EM vs. DM

Exhibit 4: Fiscal deficits & Government Debt / GDP in EM vs. DM

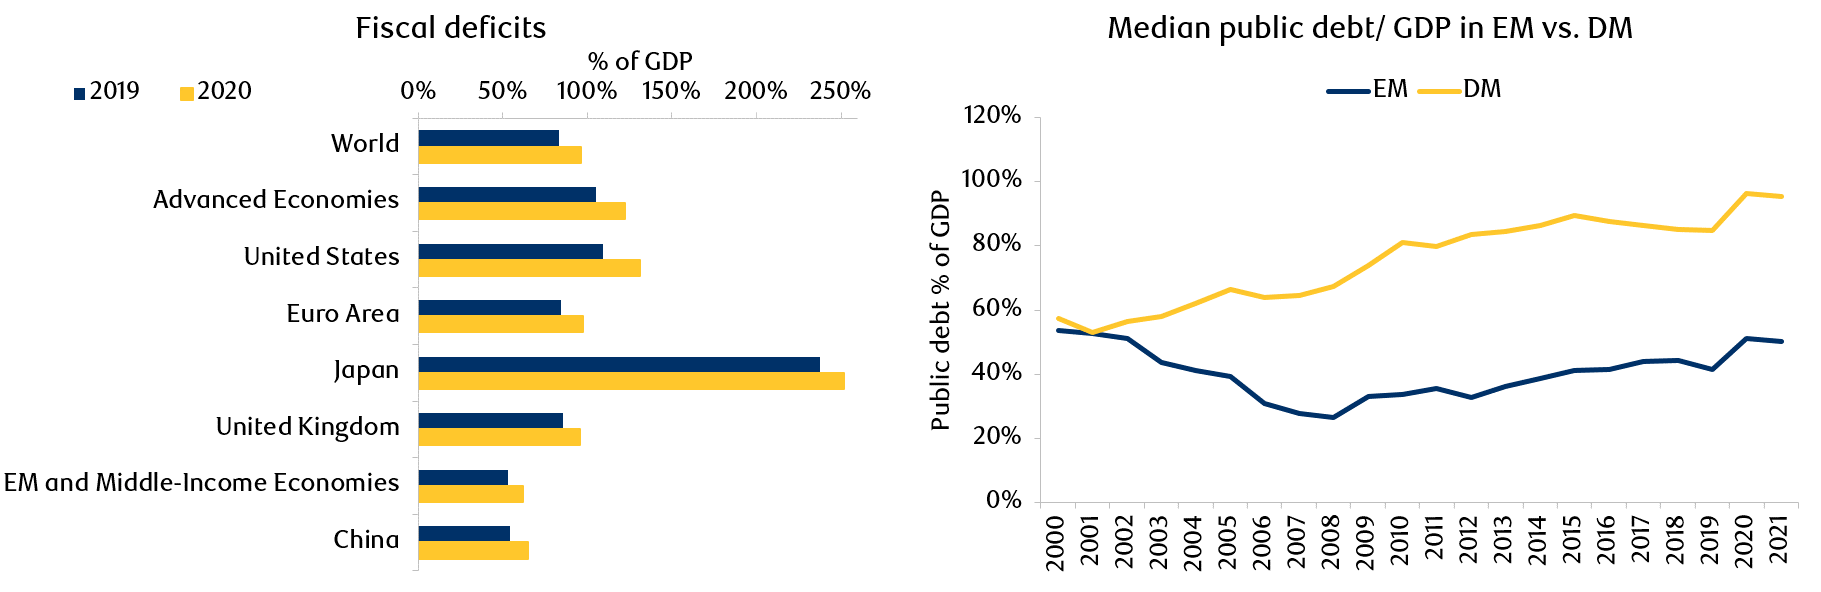
Source: LHG: IMF, Fiscal Monitor, BAML Research. Data as at April, 2020. RHG: IMF, Fiscal Monitor, Citi Research. Data as at April, 2020.

History has shown that times of crisis cause changes in human behaviour which are often long lasting. The current COVID-19 pandemic has highlighted that the human race is not invincible. We believe that one positive outcome of the pandemic is that it may prove to be a wake-up call for governments and businesses, highlighting the need to prioritize investment in social assets in order to mitigate future risks.

The pandemic has also accentuated social divisions and financial inequality that have been increasing globally in recent decades (Exhibit 5). The resulting social tensions have manifested themselves in protests, for example, in Hong Kong and Chile in 2019 and, more recently, in the U.S. and Europe.

Exhibit 5: Global wealth growth and inequality

Exhibit 5: Global wealth growth and inequality

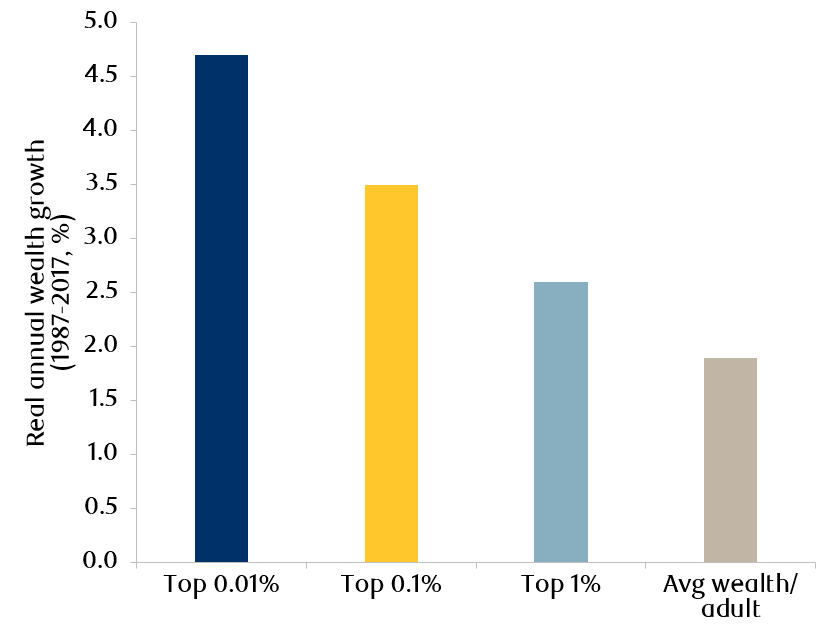
Source: Jefferies, WID. World. Data as at December, 2019. Note: Growth rates are expressed in real terms, after the deduction of inflation.

We believe the growing risks from social divisions have become too large for governments to ignore and that, as a result, investment in social infrastructure will not only be imperative for the future sustainable development of cities, but also for the survival of economic and political structures.

EM Social Infrastructure by sector

The table below summarizes some of our key findings across the key social infrastructure sectors in EM:

Housing

  • Demographic trends and rapid urbanization have created a significant housing shortage in many parts of EM.
  • The sub-standard condition of existing homes is another major issue in many EM cities, especially those where a lack of space has led to large slum settlements.
  •  Affordability is a key challenge, with EM cities topping the rankings in terms of house prices versus income levels.2
  • The supply-demand mismatch and the need to transform slum settlements into sustainable housing presents a significant investment opportunity.
  • While EM governments such as China and India have made efforts to address the shortfalls, the private sector will also have an important role to play given the scale of the deficit.

Education

  • Rising incomes, a large young population, and changing consumer attitudes in EM are increasing demand for education. EM accounts for over 80% of the global student population.3
  • The education deficit is a result of historic underinvestment. Although EM governments have increased investment in education in recent years, spending still lags DM.
  • The COVID-19 pandemic has accelerated the role of technology in education, with students relying on online tuition during lockdown. Some of these habits will likely remain permanent.
  • Investing in EM education companies has historically been challenging due to low barriers to entry. However, tightening regulation and improving brand power has made the sector more attractive in recent years.

Healthcare

  • EM healthcare infrastructure significantly lags DM, both in terms of quality and quantity. This is largely due to historic underinvestment, with governments in EM spending considerably less than DM and the global average.
  • Meanwhile, demand for healthcare is rising, given low current penetration levels, a growing middle class population, the rising burden of chronic disease, and a general increase in health awareness. The COVID-19 pandemic has further accelerated these trends.
  • We expect significant government spending on healthcare over the next decade, driven by China and India. We also see a significant opportunity for the private sector given the substantial deficits.

Public transport

  • Rapidly-expanding urban populations in EM are putting significant pressure on existing public transport services and increasing the number of private vehicles on the road. This is leading to increased congestion and poor air quality.
  • With battery costs coming down, electric cars and buses are becoming more accessible, while technological advancements such as ride-hailing apps are also enabling shared mobility.
  • Government regulations and incentives will be critical to support the ongoing switch to electric vehicles and public transport.

Water & waste management

  • Despite improvements in water-related infrastructure, the UN estimates that the number of people without access to clean drinking water is 800 million, primarily concentrated in EM.
  • Although the world has sufficient water for everyone, it is not spread evenly. Water wastage makes the issue worse.
  • It is estimated that around 80% of waste water is discharged into rivers or seas without proper treatment, which is the primary cause of water-related diseases.4 Improving access to clean water and establishing waste-water treatment facilities are therefore equally important.

Renewable energy

  • Electricity is an essential service in the modern world, highlighted by the increasing electrification of everything from vehicles to industry and commerce.
  • As the world undergoes an energy transition, driven by falling costs of renewable technology and an increasing focus on climate change, we expect more electricity will be generated by renewable energy sources.
  • EM have been the key growth area for investment in renewable energy in recent years, driven by emerging Asia.

EM Social Infrastructure by country

In order to assess the opportunities and risks of the social infrastructure theme within EM, we developed a country scorecard. Exhibit 6 summarizes our results.5

Country highlights:

  • Indonesia, India, China and the Philippines scored the highest in our country scorecard. These scores reflect a large investment opportunity owing to 1) underpenetrated social infrastructure, stemming from historical underinvestment, 2) strong economic and demographic factors driving demand for social assets, and 3) positive supply-side factors such as government support.
  • India stands out as having an attractive housing opportunity, due to 1) a significant shortfall in affordable housing, 2) over-crowded homes and slum settlements, and 3) a large young demographic driving demand. Government support has so far been positive including initiatives such as “Housing for All by 2022”, however further investment will be required given the scale of the deficit versus the rapidly growing demand.
  • Thailand, Malaysia, Russia and South Korea scored relatively poorly in our scorecard, largely reflecting already developed social infrastructure and thus a limited opportunity set.
  • South Africa’s ranking is largely influenced by its scores in healthcare, education and housing, where we see significant under-penetration which will require investment. However, the government’s ability to invest in social infrastructure is relatively low due to weak economic factors such as GDP growth and government debt. That said, this could suggest a significant opportunity for private investors in South Africa.
  • The Latin American countries fare moderately in our scorecard overall, although at the sector level we identified select attractive opportunities. Brazil and Mexico scored well in education, Chile and Colombia scored well in healthcare, while Brazil, Colombia and Mexico scored well in public transport.

Exhibit 6: Social Infrastructure – EM country scorecard

Exhibit 6: Social Infrastructure – EM country scorecard

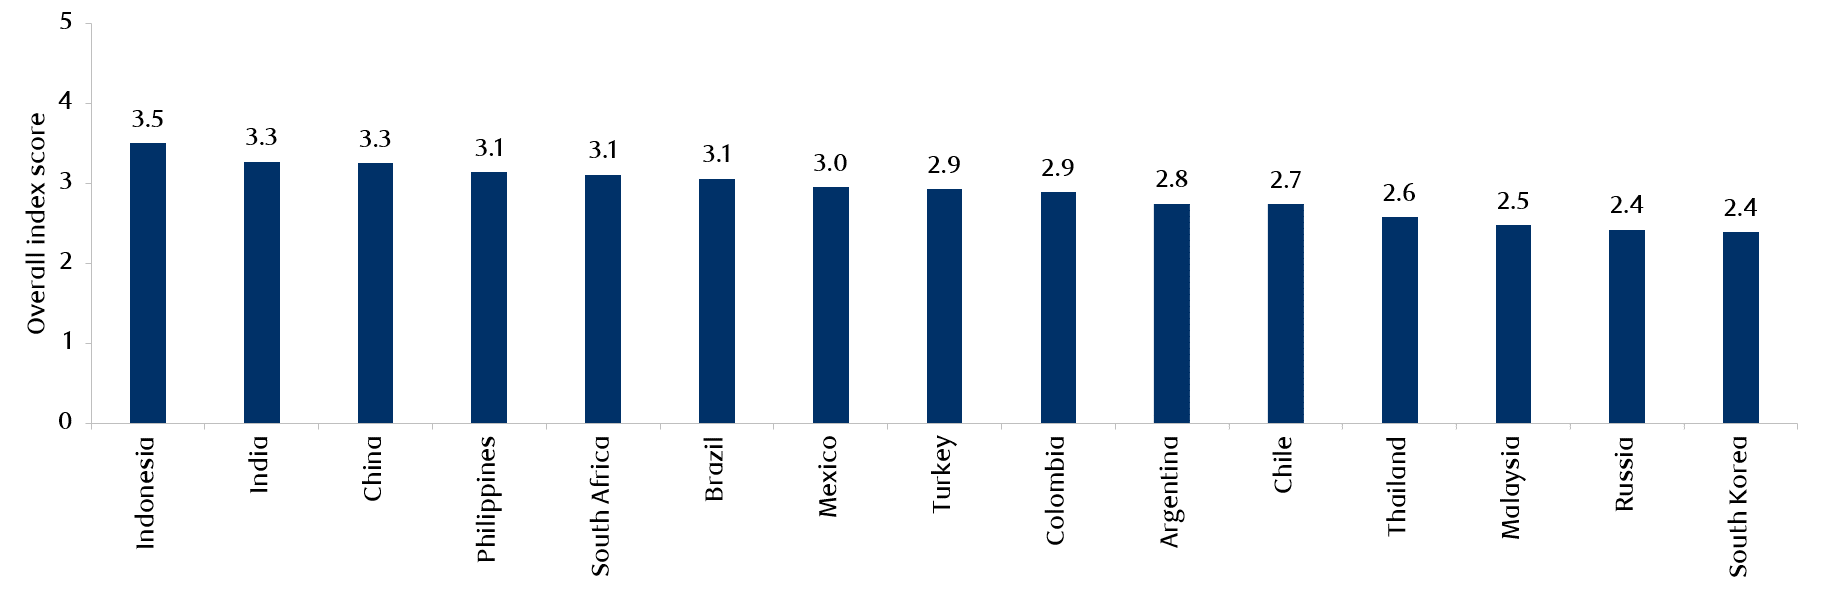
Source: RBC Global Asset Management and the RBC Emerging Markets Equity team. Data as at December, 2019. Note: the weights assigned to each parameter and the methodology behind the country scorecard are subjective. For some metrics data was not available from a uniform source for all countries, or the data points were not reported by all countries for a given year.

The RBC Emerging Markets Equity team’s thematic research helps inform our top-down investment positioning. In the case of social infrastructure, it has highlighted both risks and opportunities across the EM universe. In particular, it has reinforced the structural opportunity within housing in India, to which we maintain good exposure in our portfolios, as well as to education and health-related services more broadly. It has also highlighted risks relating to climate change and the environment at both country and industry level in EM.

Get the latest insights from RBC Global Asset Management.

1. World Bank, December 2019.
2. Numbeo, Citi Research, April 2018.
3. UNESCO, BofAML. Data as at April, 2018. Underlying data as at 2015.
4. United Nations. Data as at 2017.
5. We formulated a country scorecard consisting of 15 EM countries. We assessed the relative attractiveness of the countries based on data collected on the six major sectors within Social Infrastructure: education, healthcare, housing, water & sanitation, renewable energy and public transport. We also looked at broader economic and demographic factors affecting each country. In total, we took into account 28 different parameters across these 7 categories. The 28 parameters were then combined into one composite index with weights assigned based on our view of the significance of each parameter to the overall assessment. The countries were scored on a scale of 1 to 5 (1 = least attractive and 5 = most attractive) for each category, and a weighted score was then calculated to derive the overall index score for each country.

Publication date: October 2, 2020

Disclosure

This report has been provided by RBC Global Asset Management Inc. (RBC GAM Inc.) for informational purposes as of the date noted only and may not be reproduced, distributed or published without the written consent of RBC GAM Inc. Additional information about RBC GAM Inc. may be found at www.rbcgam.com. This report is not intended to provide legal, accounting, tax, investment, financial or other advice and such information should not be relied upon for providing such advice. RBC GAM Inc. takes reasonable steps to provide up-to-date, accurate and reliable information, and believes the information to be so when provided. Past performance is no guarantee of future results. Interest rates, market conditions, tax rulings and other investment factors are subject to rapid change which may materially impact analysis that is included in this document. You should consult with your advisor before taking any action based upon the information contained in this document.


Any investment and economic outlook information contained in this report has been compiled by RBC GAM Inc. from various sources. Information obtained from third parties is believed to be reliable, but no representation or warranty, express or implied, is made by RBC GAM Inc., its affiliates or any other person as to its accuracy, completeness or correctness. RBC GAM Inc. and its affiliates assume no responsibility for any errors or omissions.


All opinions and estimates contained in this report constitute RBC GAM Inc.'s judgment as of the indicated date of the information, are subject to change without notice and are provided in good faith but without legal responsibility. Interest rates and market conditions are subject to change. Return estimates are for illustrative purposes only and are not a prediction of returns. Actual returns may be higher or lower than those shown and may vary substantially over shorter time periods. It is not possible to invest directly in an unmanaged index.


A note on forward-looking statements:


This report may contain forward-looking statements about future performance, strategies or prospects, and possible future action. The words "may," "could," "should," "would," "suspect," "outlook," "believe," "plan," "anticipate," "estimate," "expect," "intend," "forecast," "objective" and similar expressions are intended to identify forward-looking statements. Forward-looking statements are not guarantees of future performance. Forward-looking statements involve inherent risks and uncertainties about general economic factors, so it is possible that predictions, forecasts, projections and other forward-looking statements will not be achieved. We caution you not to place undue reliance on these statements as a number of important factors could cause actual events or results to differ materially from those expressed or implied in any forward-looking statement. These factors include, but are not limited to, general economic, political and market factors in Canada, the United States and internationally, interest and foreign exchange rates, global equity and capital markets, business competition, technological changes, changes in laws and regulations, judicial or regulatory judgments, legal proceedings and catastrophic events. The above list of important factors that may affect future results is not exhaustive. Before making any investment decisions, we encourage you to consider these and other factors carefully. All opinions contained in forward-looking statements are subject to change without notice and are provided in good faith but without legal responsibility.


® / ™ Trademark(s) of Royal Bank of Canada. Used under licence.


© RBC Global Asset Management Inc., 2022