“In the 1980s, industrial production made up a quarter or more of national GDPs around the world, but that share has been in ongoing decline.”1
The importance of manufacturing as a driver of economic growth is declining. Manufacturing in emerging markets (EM), expressed as a percentage of GDP, peaked globally in the 1970s and 1980s (Exhibit 1). We believe this trend is structural and set to continue over the next decade, with the world witnessing an even more robust disintermediation of manufacturing than that of the last 10 years. We do not believe that manufacturing will become obsolete, but rather the overall size of the sector could become smaller, and that this reduction in size will be accompanied by changes to business models and participants. In this report we first examine the trends driving the structural changes, and then try to assess the implications for manufacturers to remain competitive and successful in a shrinking industry. We will also examine the implications for emerging economies, and explore the potential methods that governments and businesses could employ to circumnavigate the social dislocation that could stem from the resulting job losses.
Exhibit 1: Manufacturing (% of GDP and employment) has been declining since the 1970s
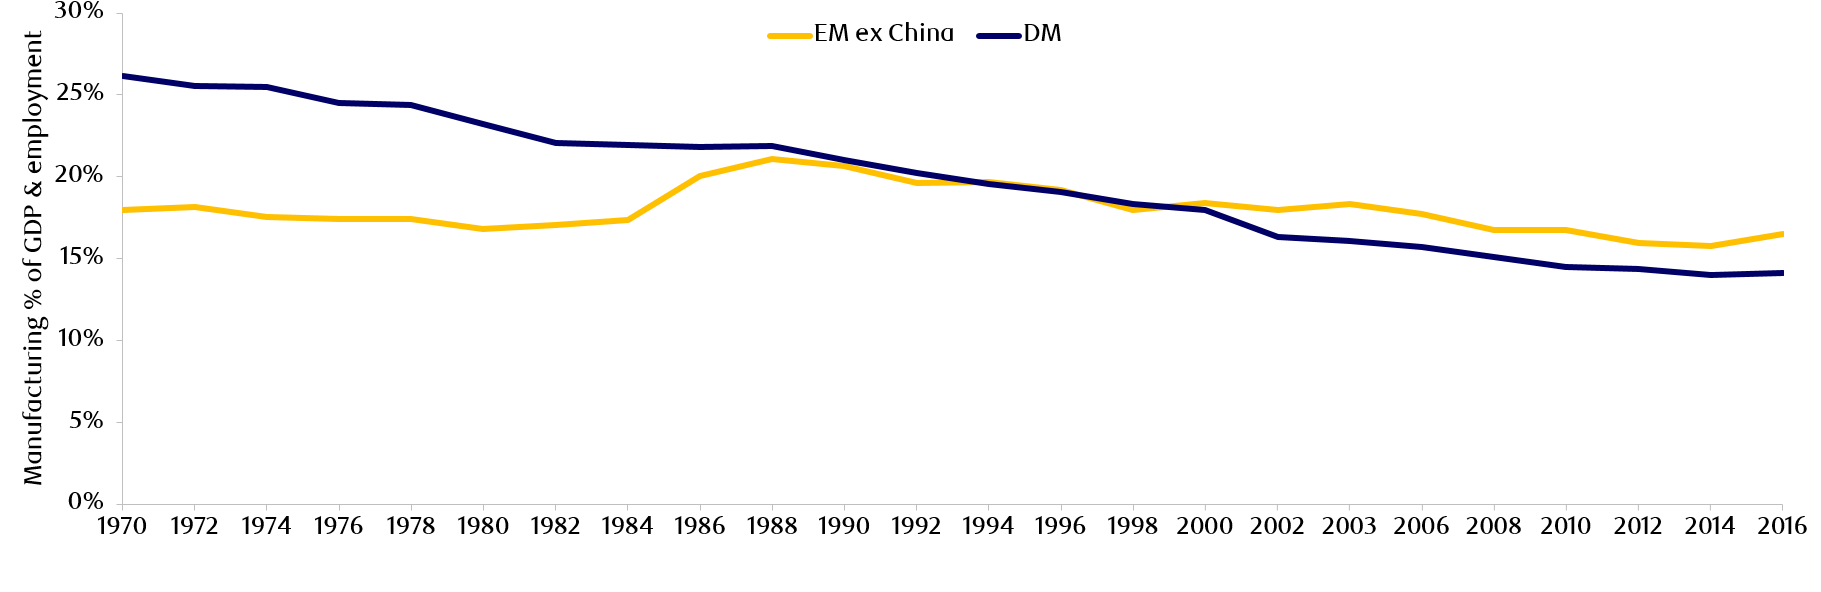
Source: World Bank, TED, GGDC, Macquarie Research. Data as at September, 2019.
Why is manufacturing declining?
Manufacturing has been a problematic area for the last two decades, and we believe that this will continue to be the case for two reasons:
- Demand for services and experiential spending is on the rise: As global GDP per capita increases, the need for houses, factories, roads, automobiles, and machinery is gradually satisfied, and consumer demand shifts towards services such as health, education, entertainment and other commercial services (see Exhibit 2 for the U.S.). We believe that as their economies continue to grow, EM will also follow this trend.
Exhibit 2: Services share of consumption has been increasing (U.S.)
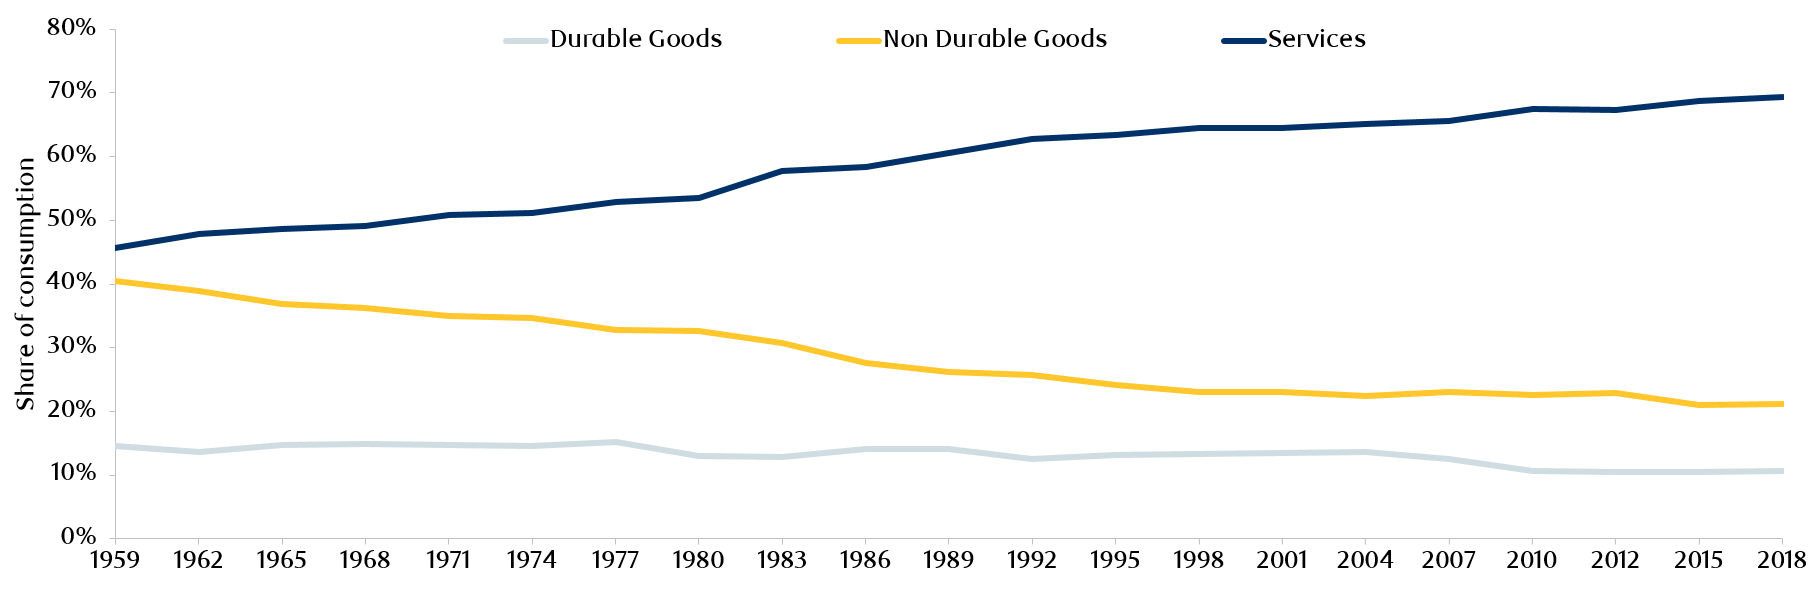
Source: BEA, Haver, UBS. Data as at October, 2019.
- This rise in demand for services is also reflected in the increasing contribution to GDP by the services sector compared to the manufacturing sector (Exhibit 3). We believe that the decline in the significance of manufacturing relative to GDP will be further augmented by the spending patterns of younger generations, and millennials, in particular, will spearhead the trend of experiential spending on leisure activities and travel.
Exhibit 3: With rising GDP per capita (purchasing power parity adjusted), services are contributing more to GDP than manufacturing globally
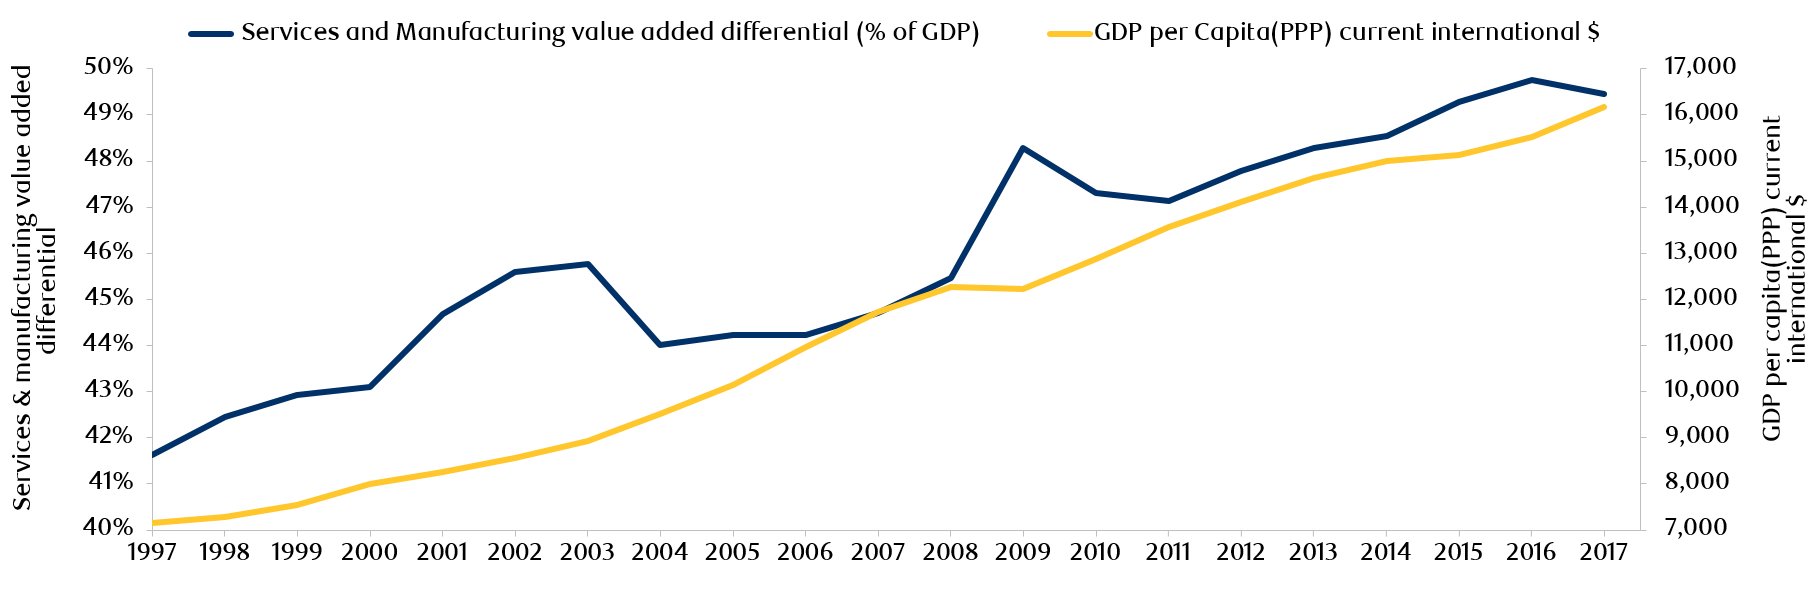
Source: World Bank, World Development Indicators database. Data as at December, 2017.
The rise of smart factories & automation is causing labour dislocation: The increased adoption of emerging technologies has led to the emergence of ‘smart factories’. Smart factories are essentially machinery and equipment that have enhanced operational efficiency owing to automation and self-optimization through data and algorithms.
Moreover, the use of automation, in particular through robotics, is rising in industrial manufacturing as reflected by declining costs (Exhibit 4). According to the International Federation of Robotics, by 2020 approximately three million industrial robots will be used in factories worldwide.2This translates to a doubling of the operational stock of industrial robots in the seven years between 2014 and 2020. Since machines are essentially able to self-regulate there is minimal manual labour required and as manufacturing processes become increasingly automated, we expect a clear dislocation of manual labour due to automation (Exhibit 5). According to Oxford Economics’ projections, approximately 20 million manufacturing jobs will be lost to automation by 2030.3
Exhibit 4: Automation is becoming increasingly economical
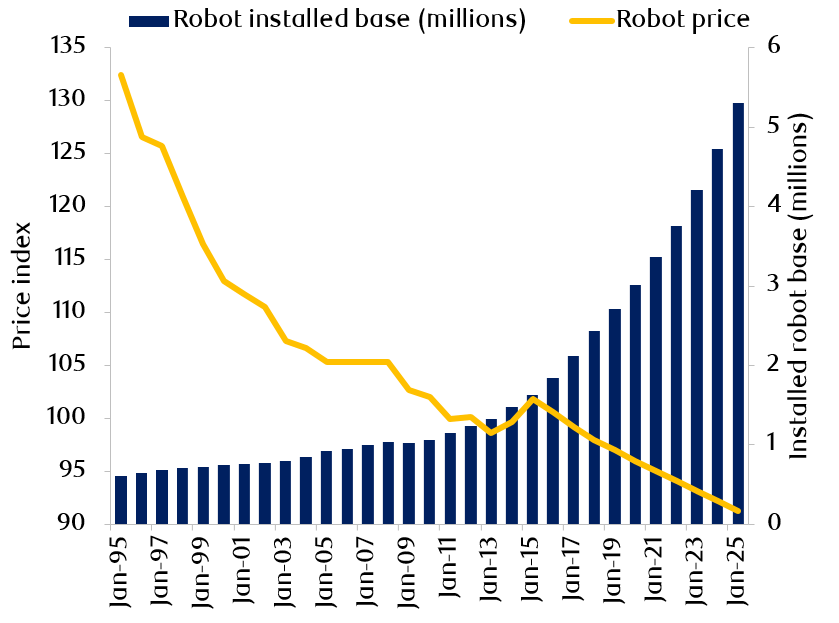
Source: IFR, BofA Global Research estimates, World Bank, BCG. Price indexed to 100 in 2011. Data as at December, 2019.
Exhibit 5: Projected job loss due to automation until 2030E
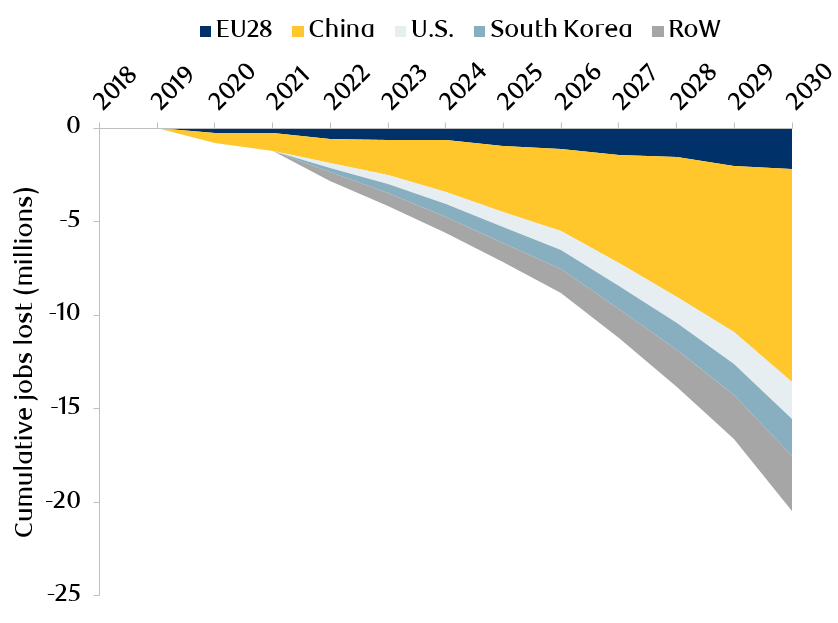
Source: Oxford Economics. Data as at December, 2019
The implications for existing manufacturing companies
There are three key implications for existing manufacturing companies:
- Manufacturing business models are shifting from value added towards value capture. Manufacturing business models thus far focused on value creation, i.e. production at the lowest possible cost at the highest possible quality, but have now started to transition into value capture which revolves around enhancing value to Now value not only stems from the manufactured product, but also experiences facilitated through the incorporation of emerging technologies like Internet of Things and artificial intelligence into hardware or services related to the maintenance of the product itself. For example, BMW is offering its cars as an on-demand service through the company’s ‘ReachNow’ program, while large engine or equipment manufacturers like GE or Siemens are charging customers for time used via the ‘Power by the Hour’ program or via ongoing maintenance service. As a result, the share of these manufacturers’ revenues from services is in a rising trend (Exhibit 6).
Exhibit 6: Manufacturers are receiving an increasing portion of revenue from their services segments
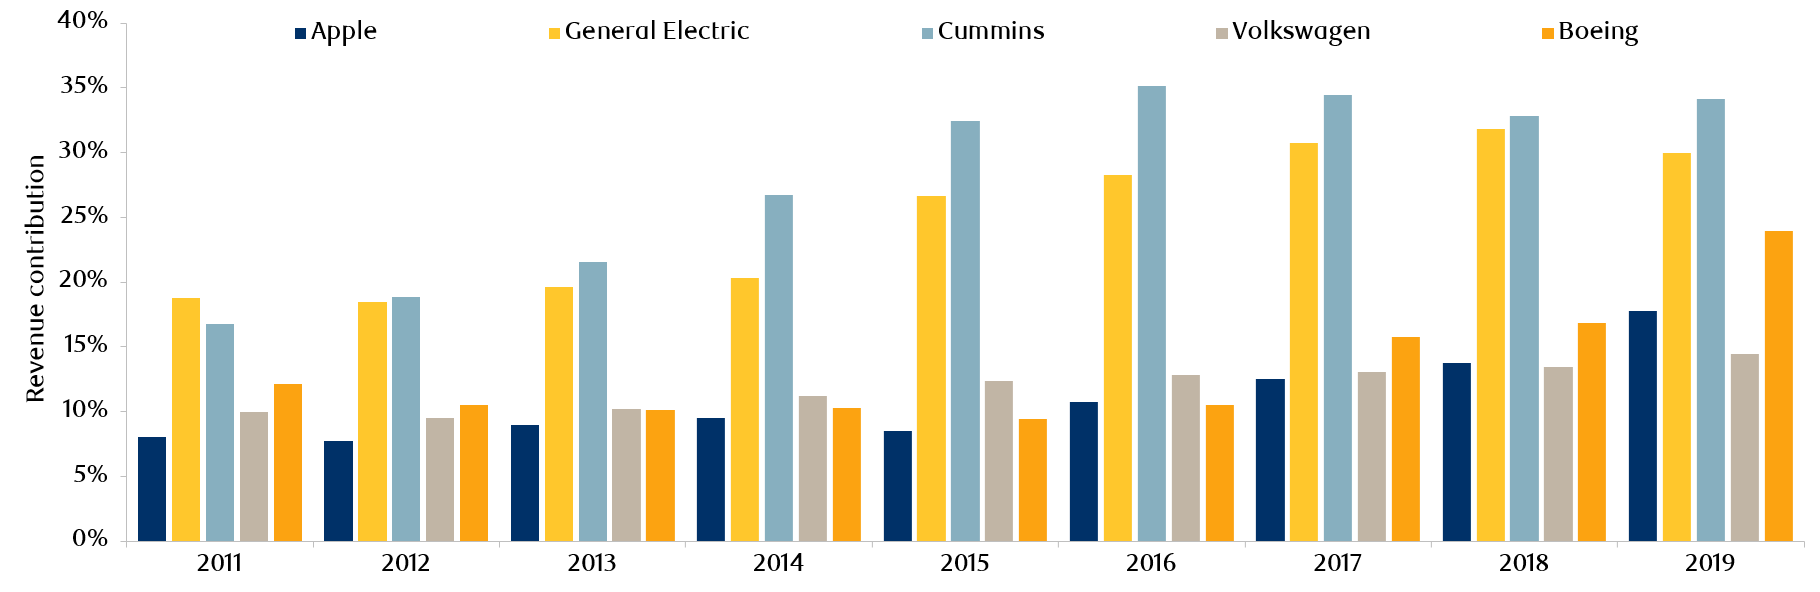
Source: Company Data, HSBC Global Research, December 2018, FactSet. Data as at June, 2020.
- Manufacturing is becoming localized, driven by the demand for customization. Proximity to the end customer to reduce lead time, supply chain risk and to facilitate customization via emerging technologies has become the key deciding factor for manufacturing companies - replacing labour
- Manufacturers are facing increasing competition owing to technology As knowledge and information are digitized it has become much easier to commercialize a product and bring it to a mass market, due to the widespread availability of digital channels. Technology has further enhanced competitiveness by significantly lowering barriers to entry. Currently, technology companies have the capacity to become any type of company, in the same way that any company can be characterized as a technology company.
The implications for EM
While this could be seen as a potential negative for EM equities it is important to consider that while some economies within EM remain vulnerable to these challenges because they still rely on low (labour) cost manufacturing as a competitive advantage, the large majority of EM countries, including China, have already moved - or are moving - away from this model. There is a clear trend in place suggesting that EM investments and exports have shifted away from commodities and other basic manufactured goods towards higher value-added products, services and intangible assets. For example, China’s spending on research and development has gone from 0.5% of GDP to 2.2% in less than 20 years, and its body of researchers and annual number of patents is now higher than that of the U.S.4
The risks to EM are fragmented. Not all EM countries face the same level of risk as some are more exposed to automation and on-shoring risk than others. To understand the level of risk, we assessed a select list of 13 EM countries based on their current exposure to manufacturing, risk from on-shoring and the potential to re-skill the population. We then created a scorecard, the results of which are illustrated in Exhibit 7. We found that South Africa, Turkey and Mexico carry the highest risk owing to high exposure to manufacturing of basic goods (ex tech) and low re-skilling potential of the workforce.
Exhibit 7: EM overall risk based manufacturing exposure, on-shoring and re-skilling potential
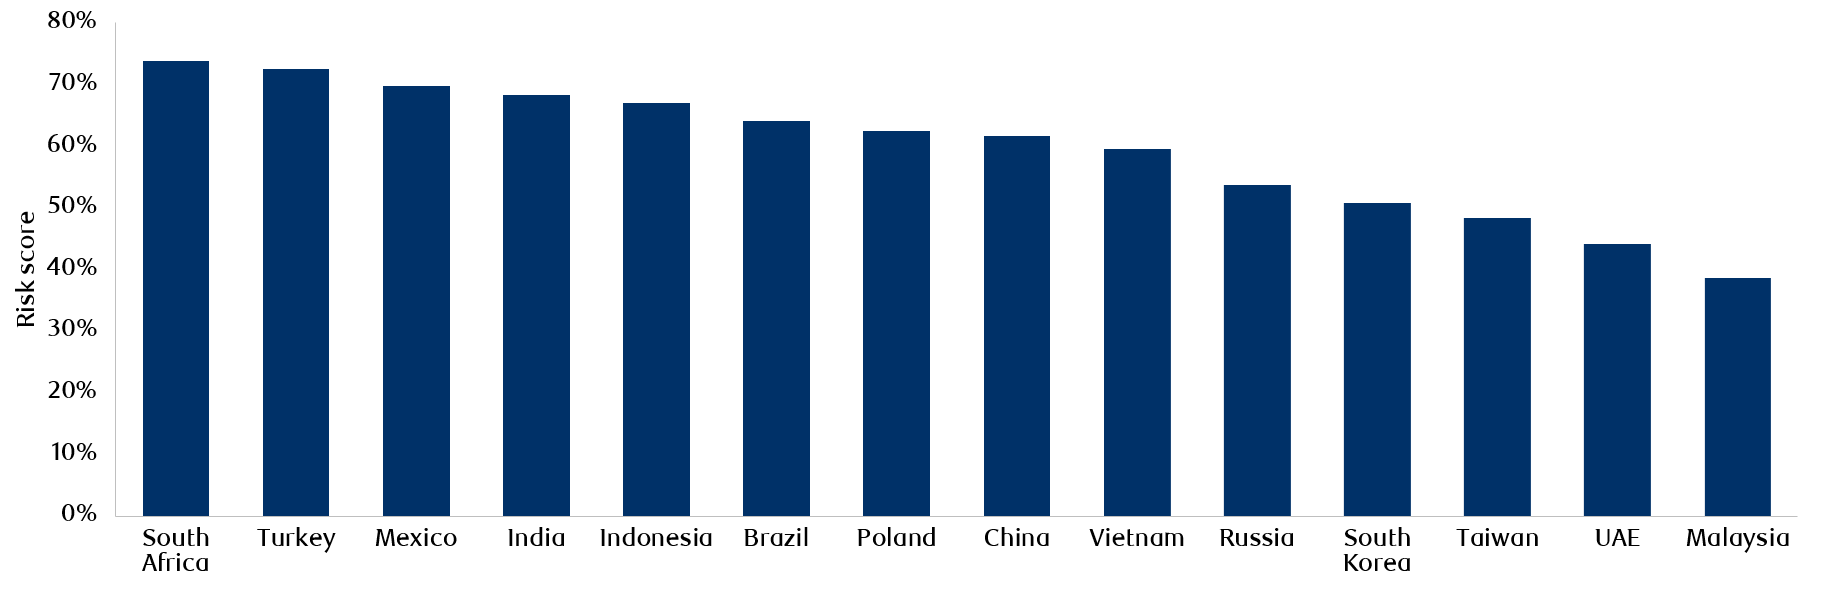
Source: RBC Global Asset Management, EM manufacturing scorecard. Data as at June, 2020.
China also has high exposure to manufacturing but we found that China has the lowest risk in terms of re-skilling potential. Out of the EM countries assessed, China has one of the most digitally literate populations with a higher quality of vocational training compared to other EM. It also spends more on research and development compared with other EM.5 We also found that the UAE has a low risk level. This is largely due to its low economic dependency on manufacturing compared with other EM in our universe. As of 2018, the UAE’s manufacturing share of GDP stood at approximately 9% compared to that of countries like China, South Korea and Malaysia which was at approximately 29%, 27% and 22% respectively.6 Hence, the UAE is significantly less exposed to changing dynamics in the manufacturing sector.
Risks to EM manufacturing is manageable.
Overall, we believe that the challenges faced by EM will not have a significant impact because of the potential for growth in EM. We expect that the negative effect of the structural decline in manufacturing – for instance labour dislocation – would be offset by the opportunities created by growth in EM service sectors. The UN Department of Economic and Social Affairs estimates that the world’s urban population will increase by 2.5 billion by 2050 and that 90% of that growth will come from EM countries in Asia and Africa. It is also expected that the largest EM - China and India - will represent around 43% of the global middle class by 2030 with approximately 88% of the growth in the world’s middle class will be in Asian EM.7 We therefore expect a commensurate growth in sectors other than manufacturing, such as services, to take place which would reduce EM economic dependency on manufacturing.
What would be the net effect of industrial technology adoption on society?
Over the course of history, employment has transitioned from one sector to another (e.g. agriculture, industry, services) creating new waves of employment. During previous transitions, the social distribution of wealth depended on individuals doing jobs that generated income. However, as automation takes effect, wealth is created increasingly by machines and not humans. This disrupts the traditional form of wealth distribution of earned income via a job, which casts doubt on the purpose of jobs in the first place. The question of jobs being carried out by machines is therefore a concern given the current rates of technological advancement, however in the short term we believe that there could actually be a rise in demand for jobs requiring high cognitive skills, driven by the increasing adoption of technology. This would include jobs such as programmers and data scientists, for example, and associated jobs like teaching within those fields. According to the latest report published by the World Economic Forum (WEF), approximately 75 million jobs would be lost due to emerging technology by 2022. However, around 133 million new jobs would be created during the same period within technology and other industries (e.g. services) producing a net increase of approximately 58 million jobs. (Exhibit 8).8
Exhibit 8: Jobs landscape by 2022E
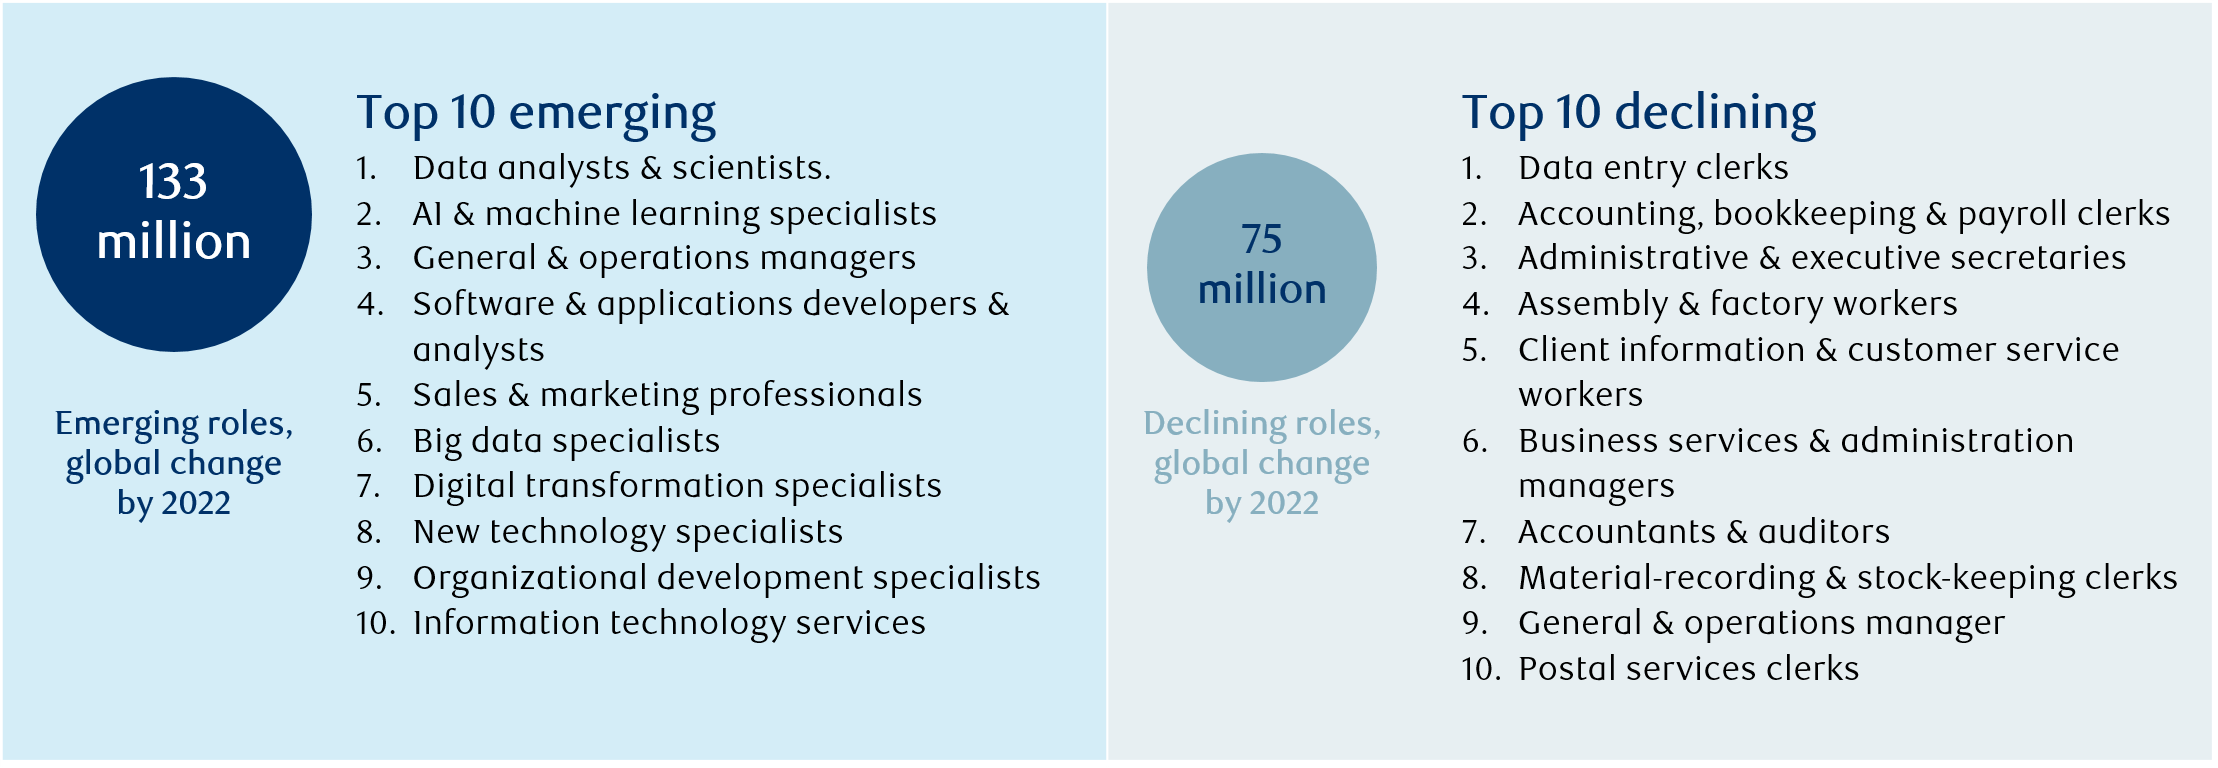
Source: Future of Jobs Report 2018, World Economic Forum. Data as at December, 2018.
The WEF data implies that the overall impact on society from technological advancement would in fact be positive owing to the net increase in jobs. Looking further ahead, at a corporate level, automation would be conducive to running resilient, sustainable businesses. The COVID-19 pandemic has shown how some businesses could have sustained operations during lockdowns if factories had been more automated and relied less on physical labour. Furthermore, automation provides the added benefit of executing tasks in factories that otherwise would be too dangerous for humans, thereby allowing businesses to protect human capital. In addition, costs incurred due to high employee turnover stemming from people engaging in repetitive tasks could be avoided by automating these tasks. As a result of these advantages, we expect that factory owners will now make a risk-adjusted assessment of the capital expenditure needed to further automate their production processes which may lead to localized and sectoral disruption in jobs markets. While it remains to be seen whether or not we will continue to create new jobs over the long term, at least in the short term, according to the WEF, it is evident that technology could create new jobs in the same way as it has throughout history.
Read more insights from our RBC Emerging Markets Equity team.