Can you provide an update on the current environment and what recovery scenarios look like from here?
- The first phase of the downturn was characterized by significant uncertainty and the disappearance of liquidity, as markets effectively froze. Effective and abundant central bank actions ushered in the return of liquidity in short order, alleviating pressures and leading to a strong rebound. As the economic downturn will be significant, the central banks’ goal in providing liquidity was to ensure that the financial markets would not magnify the disruption.
- The next phase of this cycle will be discussion around the shape of economic recovery and how that relates to market valuations. Today, our best guess is that the S&P 500 earnings level seen in 2019 could present itself in 2022.
- On the surface, the recovery in the market has left indices at valuations that would seem to reflect more optimism regarding the timing and strength of recovery. However, this is balanced to some degree by the low level of interest rates, which support higher valuations. It is difficult to characterize the overall level of the market as we’ve witnessed the formation of two distinct subsections:
- The first is characterized by businesses with stable or visible cash flow, often supported by work-from-home or online initiatives. We’ve witnessed those valuations expand quite meaningfully in relation to historical precedent.
- The second is characterized by businesses that are dependent on the timing of recovery, which have lagged.
- The market has recovered, but not all stocks have recovered equally. The equal-weight S&P 500 has lagged in recovery relative to the cap-weighted S&P 500. Large weights like Microsoft and Amazon have shown resiliency.
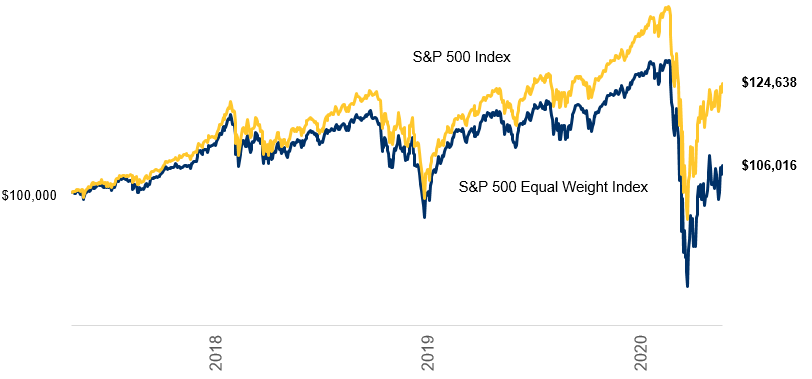
Source: Bloomberg. Three year growth of $100,000 as of May 20, 2020.
- Although the largest weights now represent more of the index than they did during the technology bubble, the comparison is not as simple. These businesses have extremely strong balance sheets and generate prodigious amounts of stable and growing free cash flow. Their valuation metrics are elevated relative to recent history, but supported by the current interest rate environment.
- However there are subsets of businesses that have seen extreme valuation expansion. These are not a focus for us at this time. The chart below illustrates this point – Microsoft and Shopify are two excellent companies that have considerable opportunity in front of them. Microsoft’s enterprise value to sales ratio is elevated relative to recent history, although less than half of its tech bubble peak. Meanwhile Shopify’s enterprise value to sales ratio – north of 50 times – is double what Microsoft’s was during the tech bubble.
Source: Bloomberg. As of May 15, 2020.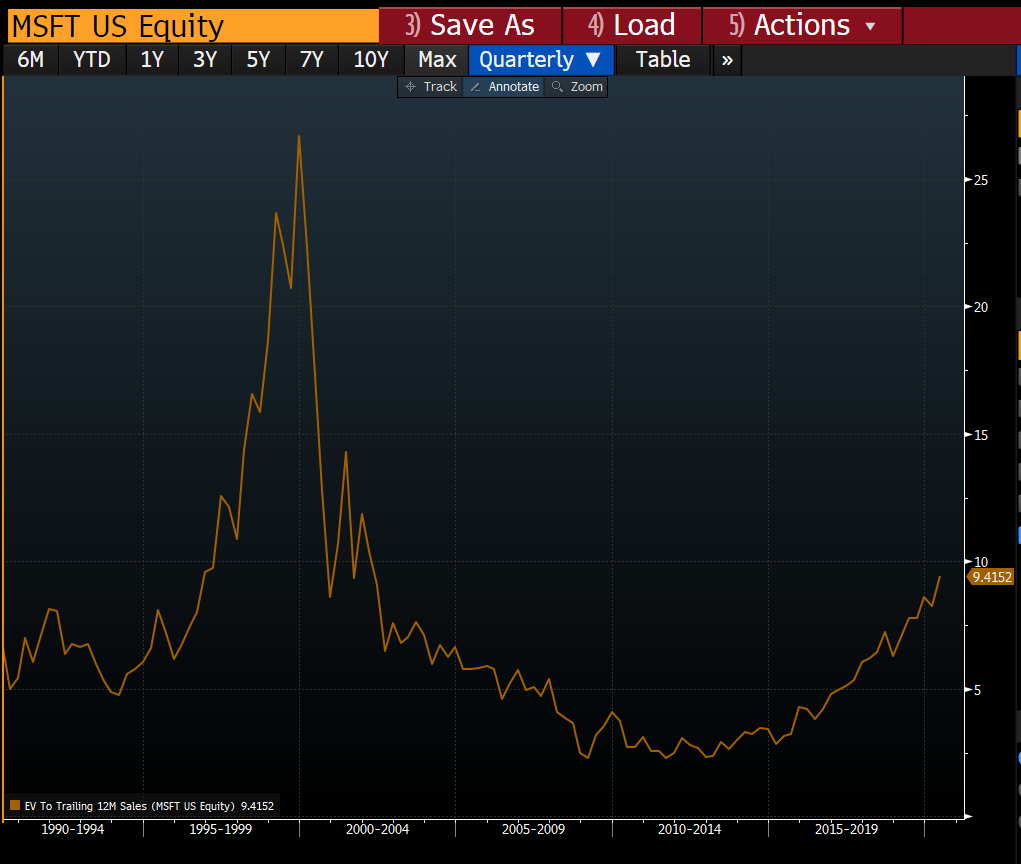

- The more economically sensitive areas of the market have lagged and we’re seeing more interesting return potential relative to a normalized economic experience (e.g. financials, materials and industrials). Within this basket of stocks, we look at balance sheet health, asking ourselves whether they can get through this environment and what our comfort level is with participation. In this basket, even when we look out to a recovery that materializes in 2022 or 2023, we believe the return profile for these stocks is attractive, notwithstanding little current share price momentum.
Are there parts of the market that are still offering compelling value? Can you talk about any shifts you've been making?
- We have been placing businesses into three camps:
- The first is defined by the set of businesses that have returned near old highs, pricing in higher valuations than we saw in January. We have been harvesting gains from this area. For example, PayPal was a very strong performer, and we sold a portion following strong guidance.
- The next camp is businesses that will benefit from a restart but are still generating reasonable levels of free cash flow. These businesses are under-earning relative to their potential, but because cash flow is positive, time is on our side. The return of more normal levels of profitability, coupled with historical valuations, could provide attractive returns. An example of this is Alimentation Couche-Tard – concerns arose around store traffic and the impact of reduced automobile traffic on gasoline sales, all of which weighed on its valuation. Another example is BlackRock, which we purchased partly on the secondary issue from PNC and partly immediately afterwards, as the valuation dipped to below average levels.
- When visibility is low, markets often price what is occurring today as if it will happen for some time. Businesses in this situation make up the third bucket. In these cases, we know the market may need to see more evidence in order to discount better days, but we also have a degree of confidence these companies can see their way through. TD is an example. We can look at the earnings they generated in 2019 and ask how long it will take to get back there – 2022, 2023 or even 2024? A normalized multiple on 2019 earnings equates to a $75-80 share price. The same could be said for JP Morgan which would be a $120-$130 stock using similar math.
Is the discount that Canada trades to the U.S. reasonable? How do we think about the two equity markets?
- The TSX has lagged the S&P 500 and, when we remove the boost from gold stocks and Shopify, the effect is even more pronounced. A significant part of the Canadian market requires some evidence that the worst has been seen in order for valuations to normalize.
- In the intermediate term, we see the possibility of elevated returns in Canada from a cyclical recovery. Over the long haul, when we think about compounding a portfolio over many years, it seems reasonable to have a healthy weighting to U.S. and global stocks.
Could you provide an update on the production outlook for the energy sector and eventual path to recovery?
- Between aviation, miles driven and other energy uses, the demand for oil has dropped dramatically, in the neighborhood of 20-25 million barrels a day. This has coincided with aggressive measures from Saudi Arabia and Russia, who have increased their production. This combination has left a massive amount of crude inventory. Many producers are now operating at negative cash costs.
- As a result, we’ve seen coordinated cuts from OPEC and producers in Canada and the U.S. As we head into Q3, if the economy gets back towards 60% of output, we think we can start to draw on inventories and see a more sustained recovery in oil prices. When we think about it from an investment case, the marginal cost of crude that drives investment is likely in the $50-55 per barrel neighborhood.
- Our largest exposures are Suncor and CNQ. Regardless of near-term dividend payment - Suncor recently cut its dividend, CNQ opted to maintain – when we look at the cash producing potential of these businesses (at what we believe the price necessary to cover the marginal cost of production) both are attractive relative to current share prices.
How do we feel about the banks at this juncture, considering headwinds like compressed net interest margins and rising provisions for credit?
- Provisions for credit will be substantial this year and likely next. This quarter will see a large rise in credit allowances for loan losses as banks attempt to estimate the impact of the economic slowdown.
- Heightened trading activity should assist second quarter earnings. However in the third quarter, trading gains will likely decline and the impact of lower interest rates will begin to impact net interest margins.
- The banks are entering this environment with healthy capital ratios. Pre-tax pre-provision earnings should cover credit losses while still allowing for dividend payment.
- While loan losses will be considerable, another key factor we’re spending a lot of time on is what we call “risk weighted asset inflation”. In a downturn as credit deteriorates, the risk weighting of assets on the banks’ balance sheet rises. When earnings are depressed by current credit losses, capital ratios can be quickly impacted by these increases to risk weighted assets. This will be a key factor in terms of banks keeping their capital ratios above the minimum standard set by regulators, but does look manageable at this juncture. For perspective, when regulators recently reduced the current capital buffer that banks must hold relative to regulatory minimums, it would allow the banking system to absorb roughly $125 billion dollars of additional risk weighted assets.
- Banks are able to implement measures to offset this. Insurance products like credit default swaps can be used as insurance against those loans. We believe the banks will embark on this in a fairly meaningful fashion in order manage their capital ratios.
- People often ask why investors won’t look through this period of uncertainty if the view on the sector is quite favourable. History tells us that investors haven’t typically given banks the benefit of the doubt until they see allowances for credit losses begin to decline. Once this happens, a return to a normal share price can happen very quickly.
The materials sector is now a significant part of the TSX. How do we make our investment decisions in this sector?
- We assess what we think the commodity price will look like on a marginal cost basis in a normalized environment. We also examine the commodity price relative to cash costs and how the business maintains their balance sheet.
- The largest industrial commodities we look at are in the agricultural area and copper. In both cases, commodity prices are depressed.
- In the case of fertilizer, potash is moving along its marginal cost at around $200/per ton. Nitrogen, which has a heavy industrial usage, has slowed down considerably as well.
- In the case of copper, we look at names such as Lundin Mining and Teck Resources. Lundin’s balance sheet is quite stable in terms of waiting for a recovery in the price of copper. The return to normalization in the businesses we are monitoring is quite high.
- Another area we look at is the lumber industry. Interfor is less exposed to the lumber challenges faced in B.C. and has considerable return potential relative to a more normal environment. Housing is often one of the first things to come back in a cyclical recovery.
- Gold stocks now make up a large portion of the TSX. Valuations of royalty companies are something that we struggle with, as investors are paying upwards of 20x EBITDA and healthy premiums to NAV (roughly 2X). Even if the price of gold rockets higher, it’s challenging to justify current valuations, although we acknowledge that these names are carrying a lot of momentum at the moment.
- We focus more on large producers like Agnico Eagle Mines. For stocks to appreciate 30% from current levels it likely requires gold prices to reach the neighborhood of $2000/oz. In all likelihood, with the amount of monetary stimulus, the price of gold has ongoing support.
Click here for more insights from RBC Global Asset Management.