Overview
This week’s note reviews the latest COVID-19 numbers, the state of the scientific effort to counter the virus and a range of economic developments. It also evaluates whether the U.S. can be expected to lock down its economy as Europe has done, and how much economic damage any such action will inflict on the U.S. (and the same for Canada). Finally, the note ventures briefly into U.S. politics and Brexit.
Overall, the macro environment has improved over the past week. Despite a skyrocketing number of U.S. infections and patchy economic numbers, there is now evidence that much of Europe is beginning to get past the worst of its second wave. The latest vaccine news was again extremely positive.
Virus developments
World
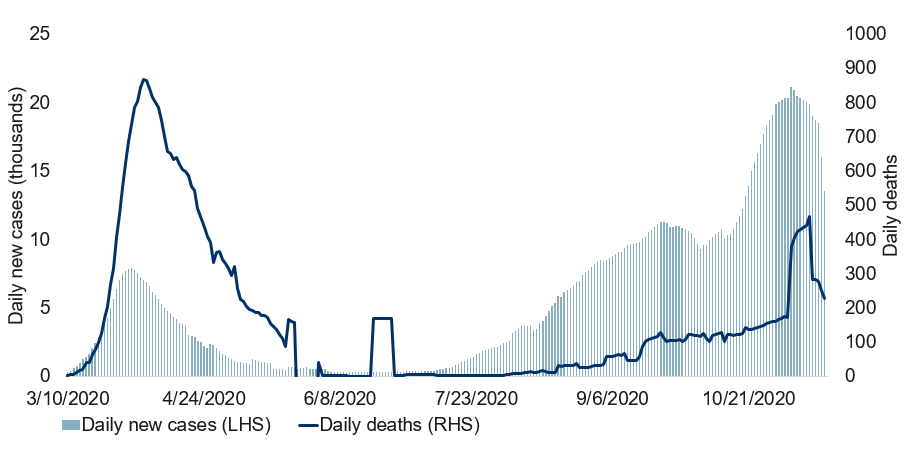
The number of new COVID-19 infections around the world each day remains in the vicinity of the all-time high, but is no longer increasing as aggressively as before (see next chart). That said, global fatalities continue to set new records.
Global COVID-19 cases and deaths
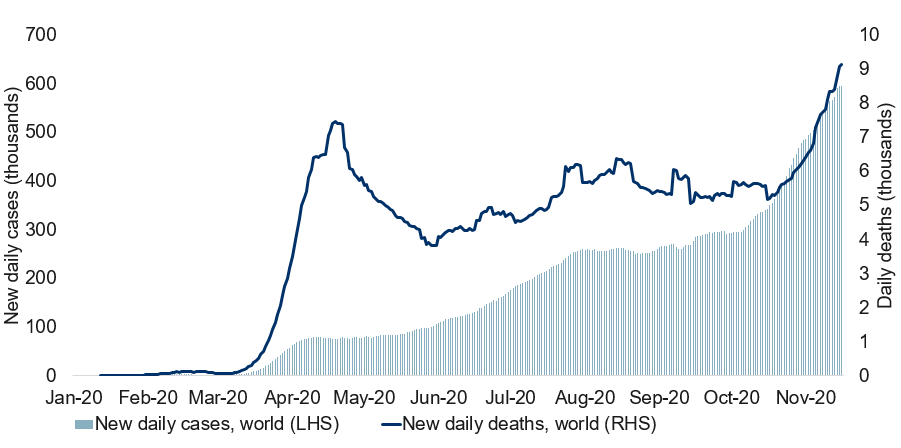
Note: As of 11/16/2020. 7-day moving average of daily new cases and new deaths. Source: CDC, Macrobond, RBC GAM
At a minimum, the global transmission rate is declining, though not yet below the critical threshold of one. This threshold separates a virus that is advancing from one in retreat (see next chart).
Global transmission rate hovering around key threshold of one
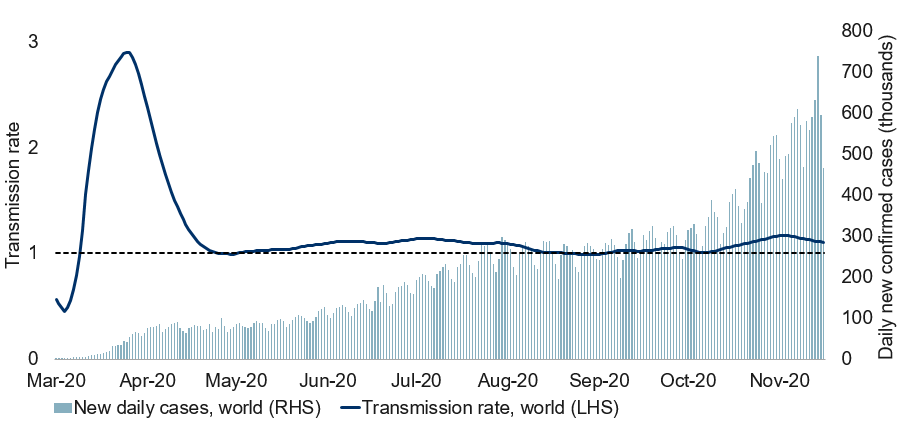
Note: As of 11/16/2020. Transmission rate calculated as a 7-day change of underlying 7-day moving average smoothened by a 14-day moving average of new daily cases. Source: ECDC, Macrobond, RBC GAM
Developed countries continue to be more adversely affected than emerging market nations, but they have tentatively begun to improve (see next chart).
COVID-19 infections: emerging markets vs. developed markets
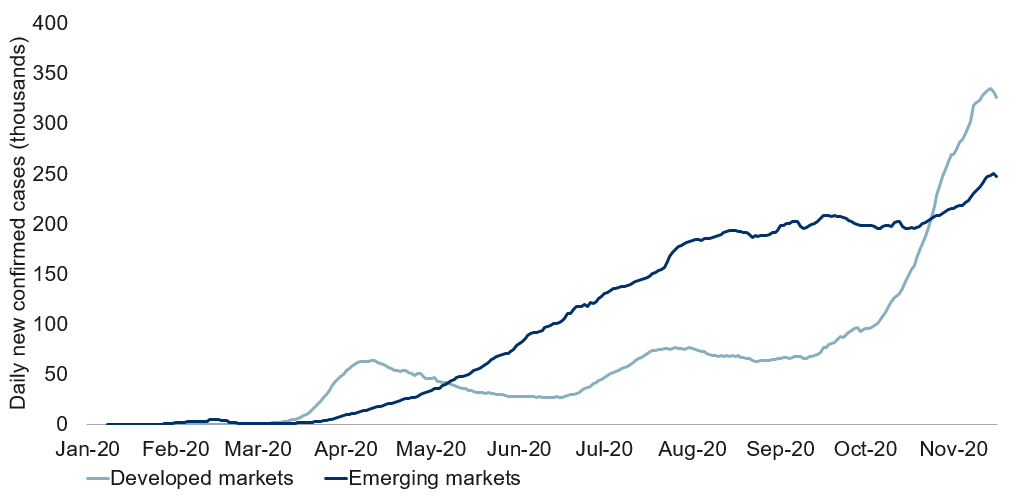
Note: As of 11/16/2020. Calculated as the 7-day moving average of daily infections. Source: ECDC, Macrobond, RBC GAM
Europe on the mend?
Europe has been the most adversely affected region of the world, but is now beginning to improve thanks to the aggressive lockdowns instituted across a broad swath of the continent. France, in particular, suffered the highest infection numbers. It locked down the most and is now beginning to reap the benefits via a sharply declining number of new infections (see next chart). The country’s fatality numbers have also significantly slowed their rate of ascent.
COVID-19 cases and deaths in France
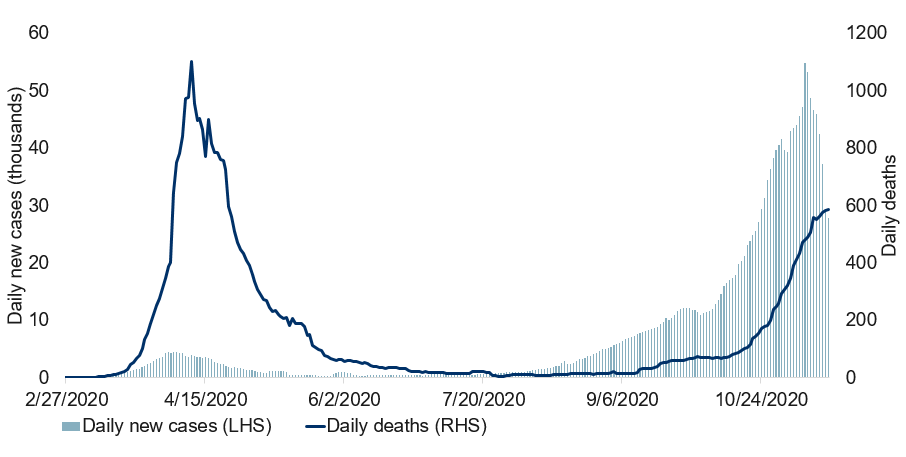
Note: As of 11/16/2020. 7-day moving average of daily new cases and new deaths. Source: CDC, Macrobond, RBC GAM
Germany and Italy have both seemingly stabilized. Spain is also staging a sustained improvement (see next chart). Switzerland and Sweden also appear to be on the mend.
COVID-19 cases and deaths in Spain
Note: As of 11/15/2020. 7-day moving average of daily new cases and new deaths. Source: CDC, Macrobond, RBC GAM
It goes without saying that these tentative stabilizations and outright improvements are a big deal. The world’s most adversely affected region is now seemingly getting better. There is hope for all countries.
Of course, the effort has not been cost-free. The Eurozone is likely to suffer significant economic damage in the fourth quarter: we pencil in a palpable economic decline. France, in particular, has implemented a lockdown that nearly matches the intensity of its effort last spring (see next chart). In turn, it is actually somewhat optimistic to conclude that the economic decline will be less than a quarter as bad as that experienced in the spring.
Stringency of lockdown by country
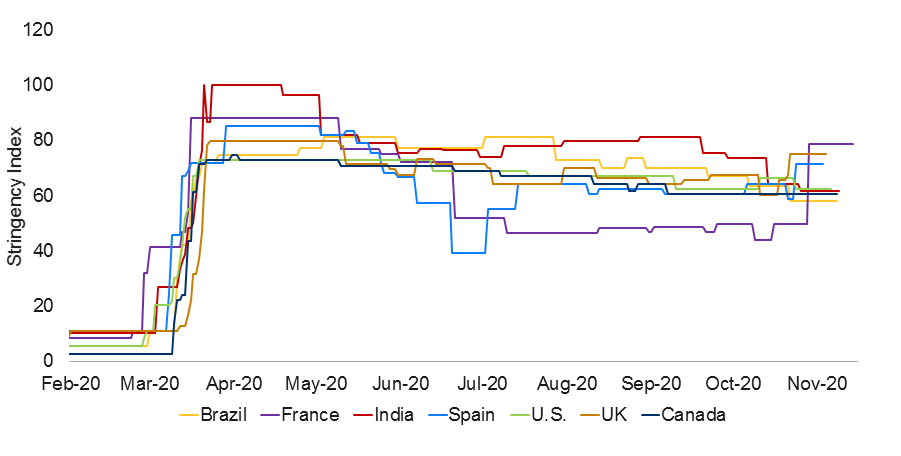
Note: As of 11/09/2020. Stringency index over time and the extent to which countries have shut down in relation to the U.S. Source: Google, University of Oxford, Apple, ECDC, UN, Macrobond, RBC GAM
In actual fact, the Eurozone has probably over-corrected. It is unlikely that so many restrictions are necessary to keep COVID-19 at bay. However, this is not to say that Europe has erred. Its daily infection rate is far too high. If the goal was to stabilize the virus, the continent has overreacted. If the goal was to bring the infection rate gradually lower over a period of months, then the continent has overreacted. But the goal is almost surely to reduce the virus count quickly, at which point a more moderate set of rules can be introduced. In this context, the reaction makes sense.
U.S. deteriorating quickly
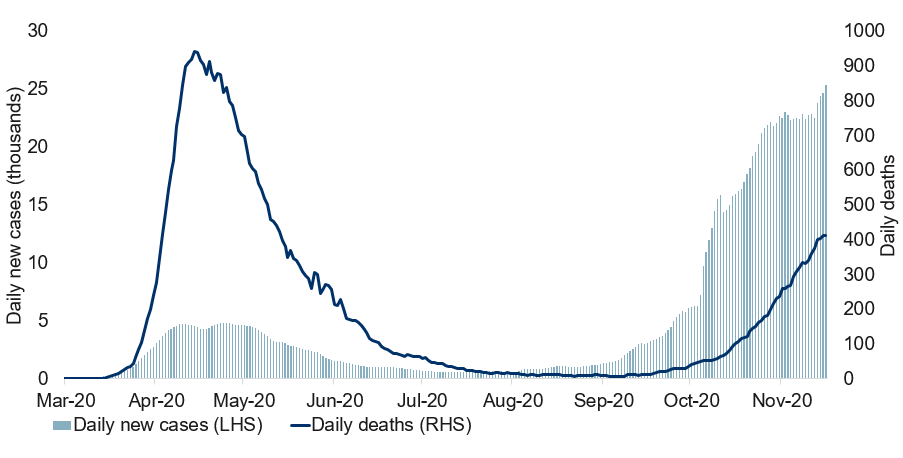
The U.S. is the mirror image of Europe, in several ways. Whereas Europe has left its schools open but shut down much of its economy, the U.S. has largely done the opposite. And while the European virus numbers are now seemingly improving, the U.S. infection rate is getting worse at a furious pace (see next chart).
COVID-19 cases and deaths in the U.S.
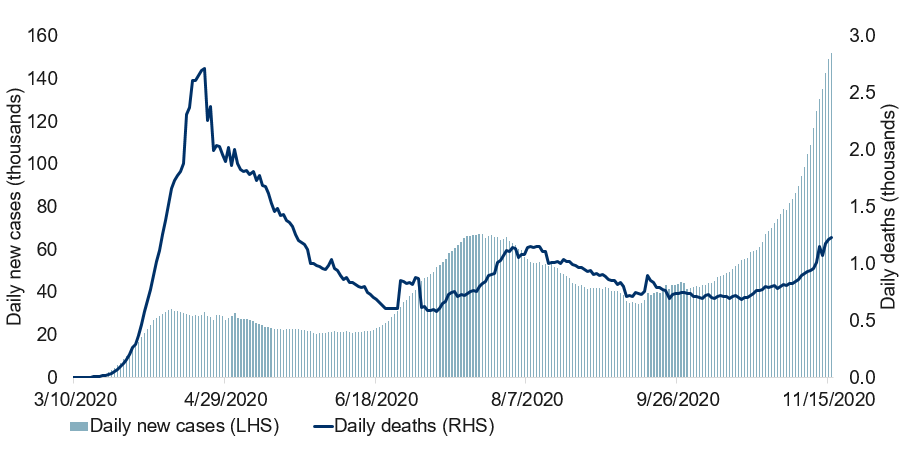
Note: As of 11/16/2020. 7-day moving average of daily new cases and new deaths. Source: CDC, Macrobond, RBC GAM
The U.S. now records around 150,000 new infections per day on a trend basis. This is a record rate, with no peak in sight. Previously, we had taken solace that the fatality numbers were still subdued, but these are now rising quickly as well. In fact, the U.S. is now recording more fatalities each day than it did during the worst of the second wave. At the current rate of deterioration, and given the multi-week lag between infections and deaths, it is not impossible that U.S. fatalities will approach their peak from last spring by the end of the year. Hospitalizations are already reported to be at record levels.
The U.S. is now beginning to tighten its mobility rules. This will probably be a gradual process given the pattern in other developed countries (and the U.S. second wave experience).
Canada deteriorating modestly
Canada’s infection numbers continue to deteriorate, though at what appears to be a decelerating pace (see next chart). We remain perplexed that Quebec swung from an improving trajectory in October to a deteriorating one in November despite no significant easing of social distancing rules. However, the province is now tentatively beginning to stabilize again.
Meanwhile, other regions of the country mostly continue to tighten their own social distancing rules.
COVID-19 cases and deaths in Canada
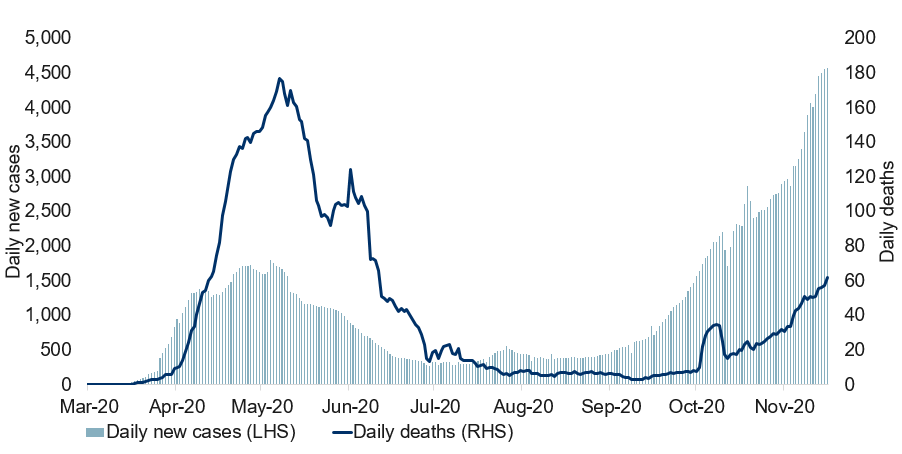
Note: As of 11/16/2020. 7-day moving average of daily new cases and new deaths. Source: CDC, Macrobond, RBC GAM
U.K. stabilization imminent
The U.K. infection numbers are again deteriorating slightly, but remain well clear of the dire situation in October, when the rate of increase was nearly vertical (see next chart). Given the aggressiveness of the country’s recent lockdown, it seems quite likely that the infection numbers will begin declining seriously within the next week or two.
COVID-19 cases and deaths in the U.K.
Note: As of 11/16/2020. 7-day moving average of daily new cases and new deaths. Source: CDC, Macrobond, RBC GAM
Virus science
Scientists continue to pursue a range of solutions for the pandemic. The scientific news has been more good than bad, but not exclusively so.
Vaccine good news
We highlight four key vaccine developments:
- Just over a week after Pfizer reported that one of its vaccines had achieved a greater than 90% efficacy rate – greatly exceeding expectations – Moderna has now reported that its vaccine has achieved a remarkable 94.5% efficacy rate. This is clearly excellent news, though it isn’t a complete shock. The two vaccine candidates both use mRNA-based approaches that were expected to yield similar outcomes.
The significance of a high efficacy rate should not be underestimated: it not only means that most people who are injected will become immune, but that the uptake will likely be higher. And, as a result of both a high efficacy rate and a high uptake, herd immunity is plausible. This had been thought a stretch up until the Pfizer announcement. It is also important that multiple vaccine-makers are succeeding, as it enables greater production than if only one vaccine candidate had succeeded.
- The distributional issues are becoming less onerous. A problem with mRNA-based vaccines is that they must be kept at extremely cold temperatures. Fortunately, the Moderna scientists have found a way to reduce the extent. They indicate that the vaccine can be kept at room temperature for up to 12 hours, that the vaccine will last up to 30 days in a common fridge, and that it can last for six months at -20 degrees Celsius. All of this compares favorably with prior expectations (and the Pfizer requirement) that the vaccine be stored at -75 degrees Celsius, which is well beyond the reach of conventional freezers. One wonders whether the Pfizer scientists might find a way to replicate the Moderna approach.
- Contrary to prior fears, it appears that the mutated form of the COVID-19 virus found on mink farms in Denmark is not actually resistant to the vaccines being developed. In turn, the worst-case scenario of a mutated virus requiring a complete restart of vaccine development efforts is no longer a realistic fear.
- Vaccine timing expectations have become more optimistic. Over the past week alone, betting markets have pivoted on the expected timing of the first 25 million inoculations in the U.S. The revised outlook has:
- Reduced the risk that this happens after June 2021 from 28% to just 5%.
- Tripled the possibility that this happens by January 20, 2021, up from 5% to 17%.
- Further consolidated the most likely scenario of spring 2021, up from 67% to 78%.
Therapeutics less impressive
Conversely, while therapeutic drugs such as Dexamethasone and Remdesivir continue to play an important role in reducing the severity of the virus, their effectiveness has proven somewhat less than initially hoped. For example:
- Dexamethasone does successfully reduce the fatality rate for hospitalized patients. But the decline is probably not as large as the 35% reduction originally estimated, with the fatality rate instead seemingly falling by perhaps 15%.
- Despite initial hopes to the contrary, Remdesivir seems not to reduce the mortality rate at all, although it does speed the rate at which patients recover.
Antibody treatments also limited
The latest evidence regarding antibody-based treatments has also underwhelmed. Regeneron and Eli Lilly have both indicated that their cocktails do not appear to help the most severely incapacitated patients. The treatments still have some value in reducing the likelihood that those with mild symptoms will be hospitalized. Unfortunately, antibody-based treatments can only be produced in limited numbers, and so it is impossible to treat everyone who has a mild infection. Presumably those at highest risk can be identified in advance and targeted.
Nanobodies
Lastly, two separate research efforts – one at the University of California San Francisco and the other at Columbia University – have constructed nanobodies to combat COVID-19. These are synthetic molecules that are much smaller than antibodies that bind to the spikes of the COVID-19 molecule, preventing the virus from gaining traction within the human body.
The treatment is inhaled daily, providing protection in the nasal passage and lungs. The treatment is theoretically inexpensive and does not require refrigeration. However, the research is still at a fairly early stage, and so nanobodies are not likely to be part of the first wave of medical solutions to COVID-19. Nevertheless, the technology could prove quite promising for later usage should the virus persist, or as a technique for combatting future infections.
Economic developments
Real-time data
Our lockdown metric confirms that a variety of countries – most prominently, European – are experiencing a significant lockdown, as per Google Mobility and Oxford Stringency data (see next chart). This is normally associated with a decline in economic activity.
Severity of lockdown varies by country
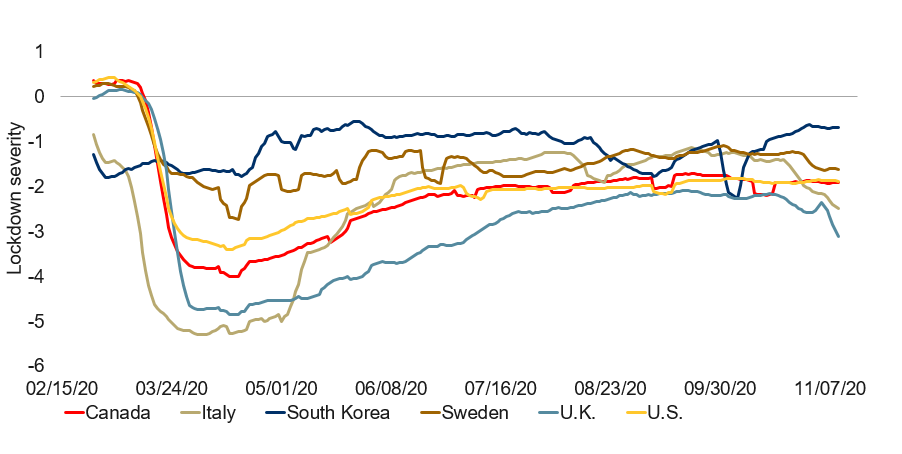
Note: Based on latest data available as of 11/08/2020. Deviation from baseline, normalized to U.S. and smoothed with a 7-day moving average. Source: Google, University of Oxford, Macrobond, RBC GAM
Two U.S. real-time indicators have also reported a bit of recent slippage, namely:
- a slight reduction in the level of new orders at the end of October (see next chart)
- a modest decline in the number of hours worked by hourly workers (see subsequent chart).
Both of these indicators highlight the possibility that the U.S. economy has ceased to grow quite so easily.
New orders and sales of U.S. businesses hammered by COVID-19
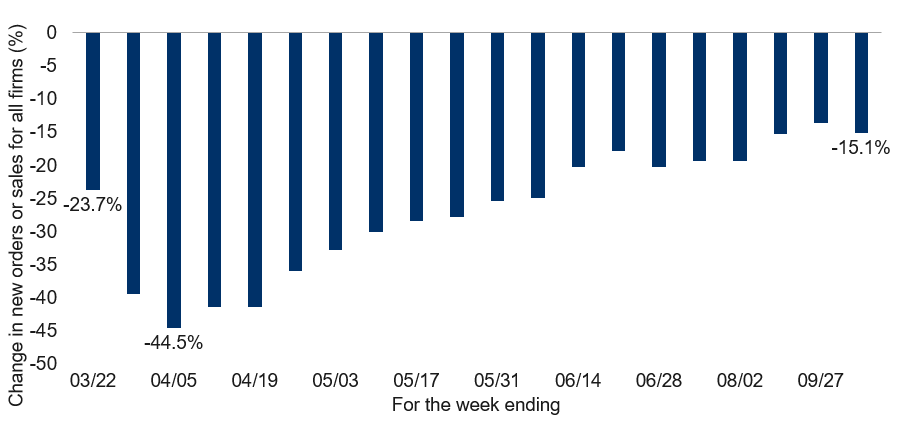
Note: As of 10/22/2020. Estimated as weighted average of % change in new orders or sales for all respondents. Source: Weekly Business Outlook Survey on the COVID-19 Outbreak, Federal Reserve Bank of Philadelphia, RBC GAM
Percentage change of hours worked by hourly workers in the U.S.
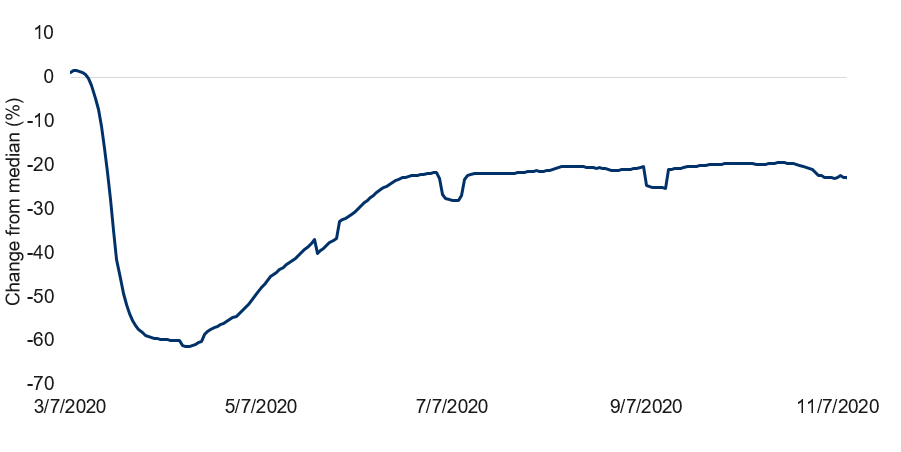
Note: As of 11/10/2020. Impact compares hours worked in a day vs. median for the same day of the week in January 2020. 7-day moving average used. Source: Homebase, RBC GAM
Our aggregate measure of U.S. economic activity – which incorporates the two aforementioned indicators alongside a host of others – has dipped slightly, though it continues to exhibit a saw-tooth pattern that makes it difficult to reach a definitive conclusion as to the direction from here (see next chart).
Notably, not all economic indicators concur that the U.S. economy is wobbling. For instance, the New York Fed’s weekly economic index continues to happily rise (see subsequent chart). The U.S. jobless claims also improved substantially in the latest week.
U.S. economic activity has shifted to low gear
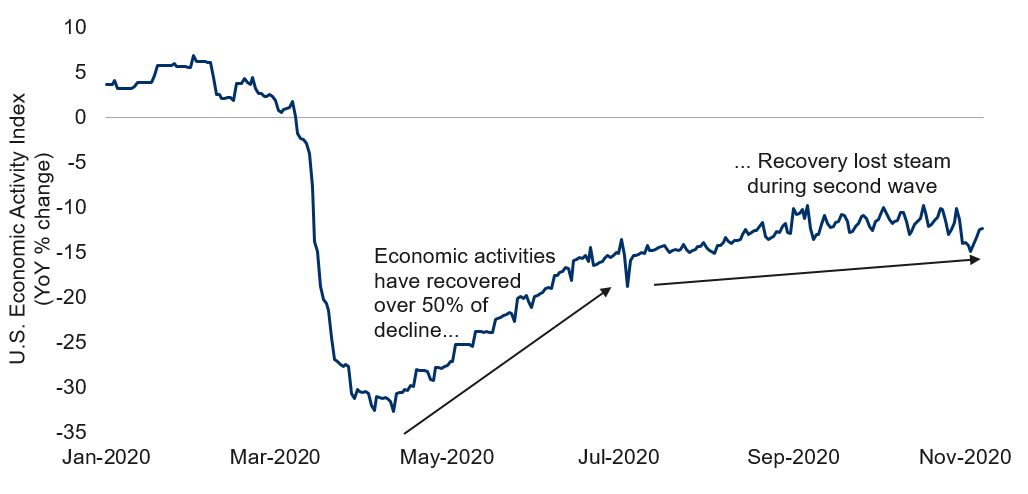
Note: As of 11/07/2020. Economic Activity Index is the average of 10 high-frequency economic data series measuring the year-over-year percentage change. Source: Bank of America, Goldman Sachs, OpenTable, Macrobond, RBC GAM
United States, Federal Reserve Bank of New York, Weekly Economic Index
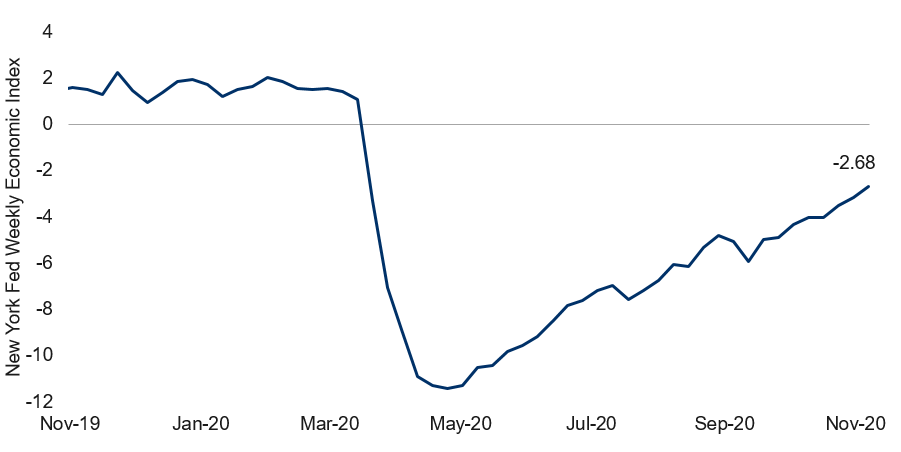
Note: For the week ended 11/07/2020. Source: Federal Reserve Bank of New York, Macrobond, RBC GAM
Let the record also show that the U.S. economy recently encountered some late-breaking good news that may not yet be fully reflected in the aforementioned lagging indicators. For example:
- The election result brings a modicum of political clarity.
- A Biden win is arguably GDP-positive.
- The vaccine news raises the prospect of a sooner return to economic normality.
Indeed, the San Francisco Fed’s measure of news sentiment has been improving at a rip-roaring pace over the past few months, and this has continued through November (see next chart).
Daily News Sentiment Index in the time of COVID-19
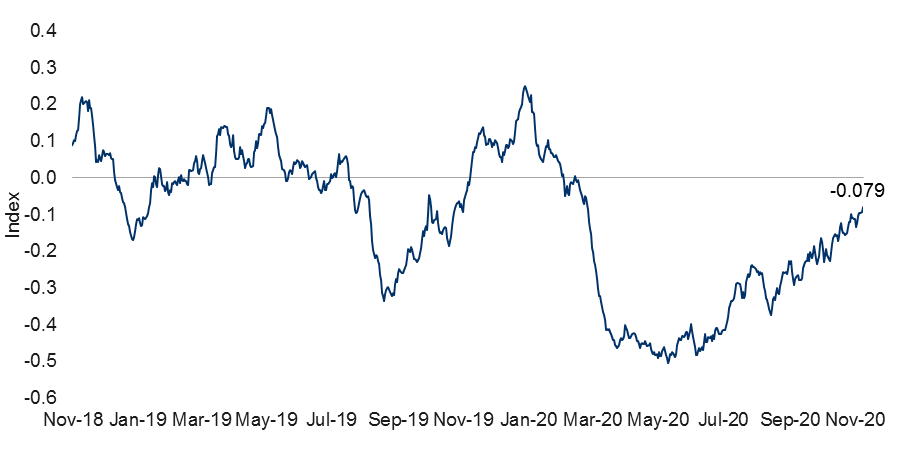
Note: As of 11/08/20. Source: Federal Reserve Bank of San Francisco, Macrobond, RBC GAM
We suspect the U.S. economy is continuing to grow, though likely at a slowing rate – and with a high probability of an outright decline in the coming months, as discussed later.
Highly varied retail success
Broadly, consumer spending remains enthusiastic, supported by a mix of rising employment and government fiscal support. Credit and debit card spending in the U.S. is outright higher than it was a year ago (see next chart).
U.S. aggregated daily card spending
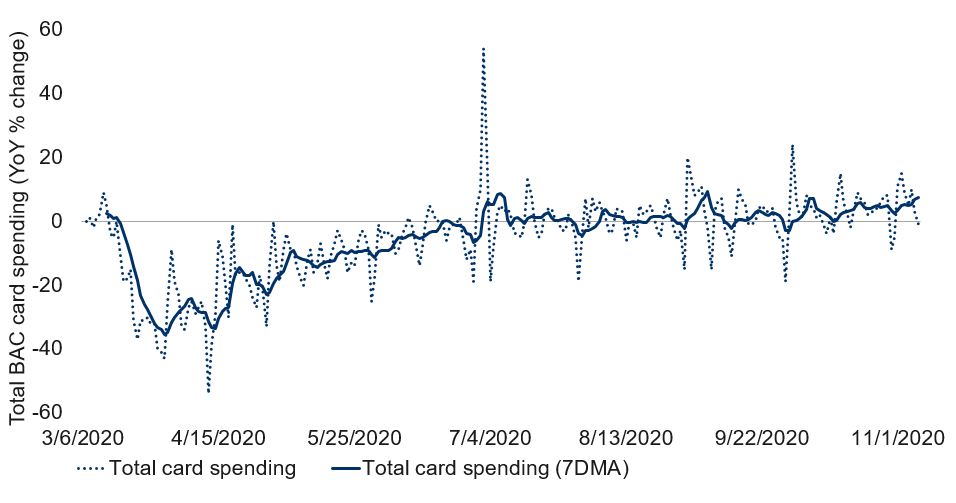
Note: As of 11/07/2020. Total card spending includes total BAC card activity which captures retail sales and services which are paid with cards. Does not include ACH payments. Source: BofA COVID-19 and the consumer weekly publication, RBC GAM
But what gets missed in this celebration is the massive sector-to-sector variation concealed beneath the surface. Some sectors are doing astonishingly well:
- online sales are 71% higher than a year ago
- home improvement spending is up 27%
- sales of groceries are 11% higher
- furniture sales are up 10%.
Conversely, others are doing very poorly. Entertainment spending is 73% down on the year. Spending on air travel is down 65% and lodgings down 46%. Transit spending is 22% lower. Department store sales are down 21%. Gas station sales are down 18%. Clothing sales are 12% lower.
Other countries
The Eurozone’s ZEW measure – a closely watched leading indicator – fell sharply in November, continuing its swoon since September. The 73.9 in September was followed by 52.3 in October and now 32.8 in November. For context, 0 is the point of delineation between growth and decline, so the reading is far from a disaster. But it is certainly consistent with decelerating growth. As indicated earlier, we expect an outright decline in Eurozone economic activity in the fourth quarter, though heavily weighted toward November and December.
The U.K. economy appeared to continue growing through September and October, recording a 1.1% increase in monthly GDP in the first month, and enjoying a 29.8K decline in jobless claims in the second. As with the Eurozone, we are doubtful that growth will continue into November given the extent of the lockdown imposed in early November.
We recently constructed a bar chart for Canada that shows the extent to which different economic sectors first suffered and have now rebounded (see next chart). This is patterned after a similar chart we have frequently deployed when reviewing the U.S. economy. While there are many interesting insights embedded within the chart, including the severity of the decline during the worst of the pandemic and the substantial variation across sectors, let us focus instead on the extent of the rebound. For instance:
- Canadian retail sales are already operating above pre-pandemic levels.
- The job market has clawed back a remarkable 78.8% of the jobs that were originally lost.
- Industrial production has reclaimed 69.3% of its lost output.
- Even food services & drinking places have recovered 64.3% of their initial decline.
Some adversely-affected sectors are missing from this analysis, but it appears that around 70% of the country’s original economic decline has now been recovered. This is a great victory.
Canadian COVID-19 recovery
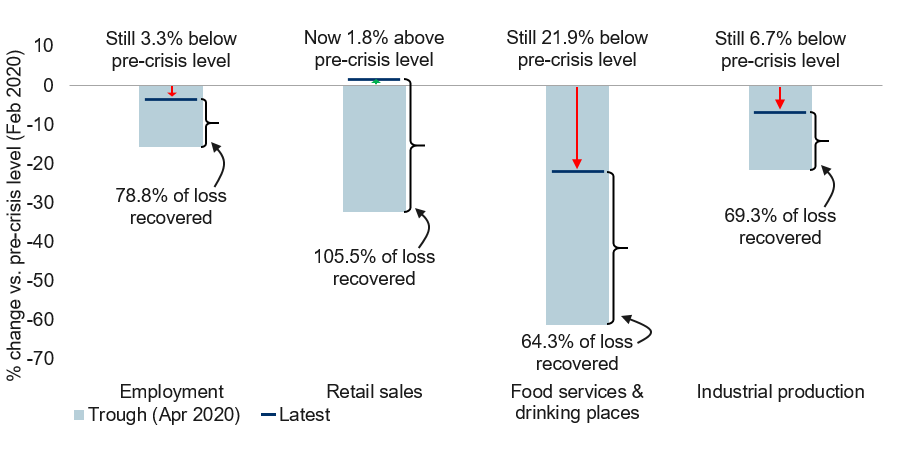
Note: Employment as of Oct 2020. Retail sales, food services and drinking places, and industrial production as of Aug 2020. Trough since Feb 2020. Source: Macrobond, RBC GAM
Will the U.S. lock down, and how much will it suffer?
The third U.S. wave is proving quite bad from an infection, hospitalization and fatality perspective.
Key questions for forecasters are whether the U.S. will be willing to significantly lock down its economy again, and what kind of damage this might do.
Will the U.S. lock down?
The U.S. political environment vis-à-vis COVID-19 is more complicated than in most countries. However, in the end, the U.S. is highly likely to impose sufficient social distancing restrictions so as to bring the virus back under control:
- Expectations were widespread during the second U.S. wave over the summer that American politicians would refuse to react. Yet the U.S. ultimately tightened its social distancing rules and succeeded in controlling the virus.
- A significant number of U.S. states and cities have begun tightening their rules in response to this latest wave, though the effort has been grossly insufficient so far. Further efforts are likely now that hospitalizations and fatalities are tracking the infection numbers higher.
- While most U.S. COVID-19 control efforts are conducted at the local level, President-elect Biden seems likely to attempt to coordinate the effort in a way that the present administration has not.
How much damage will the U.S. economy suffer?
While some economic pain in the U.S. is likely unavoidable, we suspect the U.S. will experience considerably less damage than Europe:
- The U.S. has already shown that it suffered only minimal economic damage as it tamed its second wave over the summer.
- The U.S. is unlikely to shut down its economy as forcefully as Europe has. Indeed, as we argued earlier, Europe has probably closed more than it strictly needs to.
- It feels as though Europe normalized its behavior too much over the summer. For instance, traffic congestion data shows that European cities were back to nearly normal levels of rush-hour congestion, while North American congestion levels remain well below normal. Similarly, far more Europeans returned to their workplaces over the summer than in North America, such that the recent shutdowns have proven more disruptive to Europe than they would in the U.S.
- The U.S. economy is more dynamic, meaning it is better able to adjust to altered business conditions.
- The U.S. economy has a higher speed limit than Europe, meaning that it would take a bigger shock to result in an outright decline in U.S. GDP.
At present, while we tentatively assume that the U.S. economy will shrink slightly in December and January as it comes to terms with its third wave, this doesn’t result in an outright decline in quarterly GDP for either quarter. It does map onto quite underwhelming first-quarter growth in 2021, however.
What about Canada?
There are fewer questions about Canada than the U.S.
Canada is already proving willing to tighten its mobility rules, such that there is little doubt that Canada will ultimately succeed in halting the second wave. We even suspect that Canada’s daily infection peak will arrive in a matter of weeks, at least in several provinces.
As such, the main issue becomes the amount of economic damage the country will suffer. The main considerations are similar to those presented for the U.S. in the section above. While Canada did not have a second virus wave over the summer to serve as precedent, the Canadian economy functions similarly to the U.S. economy. Further, Canada seems unlikely to lock down as forcefully as Europe, and for that matter the Canadian rule-tightening need not be as extreme as in Europe due to greater vigilance over the summer. The Canadian economy is also more dynamic than Europe’s, and has a higher speed limit.
Furthermore, and in contrast to the U.S., Canada’s actual COVID-19 outbreak isn’t nearly as severe as in either of the other two jurisdictions. Canada also continues to provide substantial fiscal support, though its sector mix is arguably more vulnerable to the virus than the U.S. Altogether, we anticipate a similarly sized economic hit to the U.S., although it arrives earlier in Canada due to a more proactive policy response: in November and December rather than December and January. And, as with the U.S., the economy manages to eke out growth in the first quarter of 2021, avoiding a negative quarter.
How much scarring?
Major economic shocks tend to leave a certain amount of structural damage. This is frequently referred to in colloquial terms as “scarring”, and in a more technical way as “hysteresis.” They are all one and the same: sometimes a recession is sufficiently bad that permanent (or at least semi-permanent) damage occurs. Sources of this scarring can include:
- Failing businesses, which do lasting financial damage to their owners, to their workers, and sometimes even to their industry more broadly (for example, by reducing competition and thus diminishing the incentive to innovate).
- Households that default on their debt or lose their home, doing enduring damage to their financial well-being.
- People who lose their jobs but lack the skills to pivot toward more fruitful sectors of the economy.
- People who are unemployed for a sufficiently long time that their skill set decays irrecoverably.
- Businesses that are reluctant to engage in cap-ex and research & development given high uncertainty and diminished growth expectations, hurting future productivity growth.
The IMF (International Monetary Fund) has estimated that the scarring from the pandemic should leave developed economies 3.5% below where they would otherwise have been, even after many years. For emerging markets, the expected shortfall is a larger 5.5%. This represents the permanent loss of perhaps 1.5 years of growth for developed countries and just over a year of growth for emerging nations.
This is an entirely plausible outcome given the depth of the economic decline, the disproportionate damage done to certain sectors and the outsized impact on low-skilled workers. However, we highlight the possibility that the damage could ultimately be somewhat smaller. Several arguments support this view.
- The recovery so far has been more enthusiastic than expected at nearly every turn. If that pattern continues, the scarring could also prove better than expected.
- Let us not forget that the economic damage is largely artificial, imposed by government edict and equally capable of being removed once the pandemic is controlled. This is not the stuff of permanent damage.
- The massive amount of monetary and fiscal stimulus that has been used to plug the economic hole should limit the extent to which temporary damage transforms into permanent scarring. Already, the government support has greatly limited corporate illiquidity and insolvency problems, and kept households from suffering too greatly.
- It seems to us that the global financial crisis ultimately did less lasting damage than was originally expected. It should be conceded that this is a matter of some debate. Growth was admittedly uninspired across the 2010s, but we believe economies would have slowed even without the crisis due to a more challenging demographic profile and as household leverage descended from undesirable levels.
Furthermore, in the immediate aftermath of the financial crisis there were widespread proclamations (including from yours truly) that the “new normal” unemployment rate in the U.S. would be something like 6.5% (versus a pre-crisis norm of 5.0%) given all of the people who would struggle to reintegrate themselves into the workforce. In actual fact, the unemployment rate eventually descended below 4%, significantly better than it had been before the financial crisis.
In conclusion, our suspicion is that the actual structural economic damage to the developed world will be perhaps half what the IMF imagines – something like 1.5% to 2.0% rather than the 3.5% it estimates. This is still a serious loss, but considerably less so.
U.S. politics
There are several U.S. political developments to share.
Presidential race
The evidence continues to overwhelmingly support the conclusion that Democratic candidate Biden has won the presidential election. States continue to formalize their count and some will be conducting recounts. Legal challenges also swirl. Yet it is difficult to fathom the end result changing, given the President-elect’s substantial advantage in the Electoral College.
As we predicted before the election, while there was a high likelihood that the election result would be contested, there was a low probability that the outcome would truly be in doubt. This is precisely the case today.
President Trump tweeted earlier this week that Biden had won, but then later clarified he was not conceding the election. The White House continues to block the customary practice of providing military intelligence briefings to the President-elect, and has withheld the federal funding that would normally assist with the transfer of power. There is some concern that the White House may also block the process of issuing security clearance to incoming staffers, further limiting transition planning and the smooth transfer of power. These things are unlikely to do enduring damage, but it arguably limits what Biden can accomplish in the early days of his presidency.
Senate races
Both Georgian Senate seats will be contested in January 5 runoff elections. In each case, betting markets assign around a 75% likelihood of victory to the Republican candidate. The Democrats need to win both seats to take the Senate. It isn’t quite so simple as to say that the Democratic Party’s probability of claiming the chamber is 25% times 25% = just 6%, since the two outcomes are highly correlated with one another. But the odds are not enormously better: betting markets assign an 18% chance, and we are tempted to think it is actually somewhere between the two figures given that prior runoffs have favoured the Republican candidate and because a centrist state like Georgia probably prefers a divided Congress than a Democratic Party sweep.
Brexit update
The deadline for negotiating a Brexit free trade agreement is rapidly approaching, as the transition deal expires at the end of 2020. Not long ago, the effective deadline for striking a new deal was described as mid-November, though this date has now passed with no apparent halt to negotiations. As with so many past Brexit “deadlines”, it appears there remains a little more time to get things done.
The main issues on the negotiating table remain fishing rights and securing a “level playing field” (referring to the rules that regulate workers’ rights, environmental rules and corporate aid). It is unclear how much progress is actually occurring, but genuine efforts are being made and both parties recognize the need for compromise.
Another issue is the treatment of Northern Ireland. While not specifically on the negotiating table, it nevertheless remains a source of friction. The U.K. and EU reached an agreement last year to avoid a hard border between Northern Ireland and Ireland, but several domestic pieces of legislation in the U.K. have threatened the durability of that commitment.
One such contradiction was just removed by the House of Lords. However, Prime Minister Johnson has now proposed a second piece of legislation that would give the U.K. government control over the tariffs levied between the U.K. and Northern Ireland. To the extent Northern Ireland and Ireland are expected to be tariff-free between one another, this would amount to modifying the tariff rate between the U.K. and the EU – a problem.
U.S. President-elect Biden has now added his voice to the matter, indicating that there will be no U.K.-U.S. trade deal unless a hard border is avoided between Northern Ireland and Ireland.
The fundamental problem in all of this is that if there are to be no significant regulatory differences or border controls between Ireland and Northern Ireland, the effective British border retreats to the Irish Sea between Northern Ireland and the rest of the U.K. This is understandably unappealing to the U.K. government. There is no obvious solution.
Despite these many headaches, we continues to assign a higher than 50% probability of a limited free-trade deal being signed before the end of the year. But the risk of a No Deal Brexit is far from zero, as demonstrated by these remaining challenges.
-With contributions from Vivien Lee and Kiki Oyerinde
Interested in more insights from Eric Lascelles and other RBC GAM thought leaders? Read more insights now.