Overview
On the whole, recent developments have been significantly more positive than negative. There are two big positives:
- A vaccine trial has reported extraordinary success, with an efficacy rate well beyond expectations.
- The U.S. election has now been (mostly) resolved, reducing the amount of policy uncertainty, and with a result that skews in a market-friendly direction.
A final, smaller positive is that additional countries and regions are tightening their social distancing rules, increasing the chance that the COVID-19 numbers will stabilize.
However, there is still a massive negative to weigh against these positives: the COVID-19 figures are, for the moment, continuing to deteriorate, and quite badly. Furthermore, even as stricter rules hold out the hope of taming the virus, this will mean more economic damage in the near term.
U.S. election results
For the first time since the arrival of the pandemic, we lead with something other than COVID-19. The highly anticipated U.S. election has now been (mostly) resolved, driven by the highest turnout (as a share of the voting-eligible population) since 1900. Democratic candidate Joe Biden has been declared the victor, and the House of Representatives has remained in Democratic Party hands. The Senate has an 80% chance of remaining Republican, contrary to pre-election expectations.
Election night and the subsequent several days were not without drama. Pre-election polls had given Biden a big 8.5 percentage point lead in the polls – verging on a landslide. However, the actual results were considerably closer, with Biden winning by just 3 percentage points. Furthermore, as Florida deviated from expectations on election night to favour President Trump and as other states proved considerably closer than expected, betting markets were sufficiently rattled that they swung from favouring Biden to assigning as much as an 80% chance of Trump winning the election as election night grew late. This then reversed overnight, to the point that Biden was viewed as the more probable winner from the morning of November 4 onward. A host of media outlets then finalized the matter on November 7, declaring Biden the president-elect (see next chart).
The changing fortunes of Biden and Trump

Note: As of 11/07/2020. Based on prediction markets data and RBC GAM calculations. Source: PredictIt, RBC GAM
Among any number of takeaways from this election – including, most profoundly, that the U.S. population remains deeply divided – the failure of pollsters is particularly notable. For a second straight election, they profoundly underestimated President Trump’s popularity. Going forward, it would seem we can no longer count on polls to provide an accurate preview of U.S. political outcomes. While disappointing, this makes sense: few people today are willing to answer a phone survey (or an internet one), and so the results are becoming ever-more distorted. Efforts to replace polling will likely include such strategies as natural language processing of social media platforms like Twitter and econometric models that connect the performance of the economy and financial markets to election outcomes.
Particularly close states included Pennsylvania, Georgia, Arizona, Nevada, Michigan and Wisconsin. But all have seemingly landed in Biden’s lap as late-tallied mail-in votes have pushed him over the top.
Complications
Might anything yet threaten the apparent Biden victory? There are arguably more than the usual number of potential complications. Ultimately none are likely to reassign the Presidency to Trump.
Technically, U.S. states have until early December to finish counting and formally assign an Electoral College slate. While this could yet change the precise vote tally, too few votes remain uncounted to change who has won each state. Recounts seem likely in a few states with particularly tight races, but past recounts have not significantly changed the result. Of course, it is technically possible for some states to ignore voters and assign an Electoral College slate of their own choosing. However, none have suggested they will do this and it would be nearly unprecedented. It would also take multiple states pursuing this radical action before the result changed.
The Republican Party has mounted several legal challenges in response to the closeness of the results, but legal experts argue these are mostly, if not entirely, without merit. An effort in Pennsylvania to invalidate mail-in votes that arrive after Election Day is not completely impossible – the conservative wing of the Supreme Court has already argued the inclusion of these ballots may be unconstitutional – but for the moment the Court is allowing these votes to count. One estimate puts the number of such ballots at probably fewer than 1,000 – much smaller than Biden’s 45,000-vote lead in the state.
While the Supreme Court has a substantial conservative leaning, it seems unlikely to play a significant role in determining the election. And let the record show that, in 2000, the Supreme Court ultimately ruled in favour of the original election result as opposed to allowing further recounts. If replicated, that would favour Biden.
The fact that President Trump has not yet issued a concession speech – while unorthodox – does not mean that the transfer of power will be delayed or complicated: Biden will become the president on January 20 whether Trump is in attendance, in the White House or elsewhere.
Senate race
The one result that has yielded a tentatively different outcome than expected – as opposed to simply a closer race – is in the Senate. It was always expected to be the closest of the contests, but markets now assign an 80% probability that Republicans hang onto the chamber, in contrast to pre-election expectations that Democrats had around a 60% chance of capturing the majority of seats (see next chart).
Likelihood of winning Senate by party

Note: As of 11/07/2020. Based on prediction markets data and RBC GAM calculations. Source: PredictIt, RBC GAM
But the Senate race isn’t quite done yet. The Republicans currently hold a two-seat lead over the Democrats, with two races yet to be concluded. While the Democrats winning both of these is not overly likely and only technically gets them to a tie, it should be noted that the (Democrat-elect) Vice President serves as a tie-breaker in the Senate. As such, it is still possible that the Democrats effectively take the Senate and earn the ‘blue wave’ that many were expecting before the election.
Both unresolved seats are in Georgia. This makes sense in that Georgia has also proven a swing state in the presidential vote, but it is unusual that there are two separate races in a single state. Some states don’t have any Senate elections in 2020 given that the term for senators is six years and each state only has two. In Georgia’s case, one seat happened to be up for re-election while the second one opened when the incumbent resigned early.
The nuances of Georgia’s election system are such that the Senate races are extremely crowded, with 20+ candidates. Should any candidate not receive more than 50% of the vote – and this threshold has definitely been missed in one race, and is close in the other – a run-off election between the two leading candidates occurs on January 5.
Let the record show that the Democrat candidates will still have an uphill battle to win one, let alone both theoretical run-offs. Their opponent is strongly favoured in one case and moderately favoured in the other. Hence the merely 20% chance that the Democrats win both and capture the Senate.
In fairness, even if the Democrats managed to win the Senate, they would lack the ability to act forcefully. Reasons include:
- Senators do not vote in lockstep, meaning that Democrats would have to vote with unanimity to achieve even the slightest of majorities.
- Legislation can be impeded by the filibuster unless there is 60%-plus support – a threshold that is well out of reach in any scenario.
- The House of Representatives – while still in Democrat hands – is tighter than it was before the election. As such, even slight dissent among Democrats in the House would limit legislative action.
- The Supreme Court now skews heavily in a conservative direction, such that any legal challenge against new (or existing) legislation could undermine Democratic Party aspirations.
Policy outlook
Our views haven’t shifted significantly with regard to what a Biden win means from an economic perspective. We view his win as a mild economic positive given the prospect of more fiscal stimulus, a greater effort to control COVID-19 and more growth-friendly immigration and trade policies. To be sure, the risk of tax increases partially undermines this, as does the prospect of additional regulations – but not the point of completely unwinding the conclusion (see next table).
Biden platform relative to Trump and implications

Note: As of 10/30/2020. Source: RBC GAM
It should be noted, of course, that a divided Congress limits the enthusiasm with which any of these policies can be pursued. For instance, whereas a Democratic Party sweep might have unleashed as much as $5 trillion in stimulus, the expected political configuration will probably permit “only” $1 trillion to $2 trillion.
On the other hand, tax increases are far from certain, both because they would be unconventional if delivered during the early stages of an economic recovery, and also because the Senate is unlikely to permit such efforts.
But for all of the restrictions that a divided Congress impose on a president, the White House can still get some things done. As demonstrated over the past four years, presidents can:
- impose or remove tariffs
- engage with multinational institutions
- conduct foreign policy
- issue executive orders that alter the interpretation or enforcement of existing laws, and
- stop legislation that Congress wants to pursue.
As such, there is still scope for Biden to reduce some tariffs, strengthen international ties, revisit the U.S. relationship with China, Iran, Cuba and Russia (strengthening ties with the first three and potentially paring them with the fourth), and introduce new environmental measures. While the China relationship may improve somewhat, we expect it to remain frosty.
Furthermore, let us not underestimate what Biden may be able to accomplish in a Republican Senate. He is fundamentally a moderate, has many decades of Senate experience and could yet persuade a few of the Republican senators expected to retire in two years to support certain centrist initiatives. This is not to say he is Lyndon Johnson incarnate, but there are some parallels.
Market response
As expected, the Biden win has proven stock-market positive, bond-yield positive and U.S.-dollar negative.
However, we wonder whether the stock market would have rallied regardless of the outcome. Undeniably, there is a logic to the post-election rally. Biden is associated with fiscal stimulus. And a divided Congress limits more extreme actions such as tax hikes.
However, that wasn’t the narrative before the election. Before the election, the mounting prospect of a ‘blue wave’ had seemed to excite the equity market on the basis that it would permit truly massive fiscal stimulus. For that matter, it is possible that the stock market would have expressed pleasure at a second Trump term to the extent this was the stock market’s preferred permutation over the summer and given how markets suddenly rallied behind Trump after the 2016 election. The hope of tax cuts springs eternal.
Obviously these are inconsistent arguments – how can the market prefer all outcomes simultaneously? Perhaps the real answer is that the stock market is simply happy to be past this period of high uncertainty.
COVID-19 approach
While President-elect Biden is already putting together a COVID-19 taskforce, the reality is that the bulk of American pandemic policy is set at the state and county levels. The federal government via the Centre for Disease Control has surprisingly limited authority. As such, we should not expect a radically different approach to the virus after Biden has been installed in the White House. That said, Biden should send more consistent, science-based messaging and will likely try to encourage greater coordination between public health authorities and with the federal government.
Lame-duck session
While it is impossible to rule out that Trump pursues a scorched Earth policy during the lame-duck session before Biden is inaugurated, this is unlikely.
Additionally, while it is possible that a fiscal package might come together before 2021, it seems more likely that the Democrats will wait until 2021 when they have a small chance of capturing a majority in the Senate and can also give the new president credit for the stimulus.
Canadian implications
From a Canadian perspective, there are a number of implications arising from the U.S. election. More are positive than negative:
- What’s good for the U.S. economy is usually good for Canada (see next chart).
- Diminished political and policy uncertainty is good for all countries.
- Canada will likely enjoy better political relations with the U.S.
- It is helpful if Canada’s ally reclaims its global leadership position.
- Similar COVID-19 control strategies could allow an earlier Canada-U.S. border re-opening.
- Canada may suffer fewer U.S. tariffs, and the U.S. may join the CPTPP trade deal(The Comprehensive and Progressive Agreement for Trans-Pacific Partnership).
- Higher U.S. taxes, while far from certain, would improve Canada’s relative competitiveness.
- Canada would benefit from a greater environmental effort in the U.S.
On the flip side, Canada suffers several disadvantages in a Biden presidency:
- Stricter U.S. environmental rules might reduce oil demand and limit pipeline expansion.
- A return to more normal U.S. immigration levels might reduce the quality of Canadian immigrants.
- A weaker U.S. dollar under Biden hurts Canada’s relative competitiveness.
Canadian and U.S. growth normally move in sync

Note: As of Q2 2020 for Canada, Q3 2020 for U.S. Source: BEA, Statistics Canada, Macrobond, RBC GAM
Virus developments
While the election has unleashed good cheer for risk assets, the virus numbers continue to point in the opposite direction. Globally, the world now records more than 500,000 new infections per day. Fatalities have now risen to 8,000 per day (see next chart).
Global COVID-19 cases and deaths

Note: As of 11/09/2020. 7-day moving average of daily new cases and new deaths. Source: CDC, Macrobond, RBC GAM
Developed countries continue to suffer the brunt of the new infections. They are recording around 65% of the cases versus their 15% share of the world’s population (see next chart).
COVID-19 emerging markets vs. developed markets infections

Note: As of 11/09/2020. Calculated as the 7-day moving average of daily infections. Source: ECDC, Macrobond, RBC GAM
Among emerging market (EM) countries, Poland is now up to 24,000 new infections per day and still rising. That said, it recently aggressively restricted social interactions such that we expect its count to peak over the next few weeks. India – for a long time the country with the most daily infections before enjoying a downward trend for several months – has ceased to improve. India is now stuck at around 50,000 new infections per day.
Europe remains challenged
In the developed world, Europe remains the worst-affected region. France continues to struggle, with around 50,000 new infections per day (see next chart). The country now also records around 500 deaths per day. This is roughly half the rate from the first wave in the spring, and the numbers are still rising.
COVID-19 cases and deaths in France
Note: As of 11/09/2020. 7-day moving average of daily new cases and new deaths. Source: CDC, Macrobond, RBC GAM
Elsewhere in Europe, Italy is now up to 30,000 new infections per day and nearly 400 fatalities per day. Germany’s infections also continue to rise, but are at a lower 18,000 per day and the rate of ascent is slowing significantly. Spain is also seemingly flattening out (though it has a particular knack for then re-accelerating). The country reports approximately 20,000 new infections per day.
The continent continues to implement more stringent lockdowns in an effort to tame the virus. Germany has now begun a partial lockdown that includes closing restaurants, bars and gyms for a month. Italy is now shutting down six regions with its most drastic restrictions since March. Greece has also announced a new national lockdown.
These restrictions are beginning to become visible in the Oxford stringency data, with France’s recent shutdown particularly prominent (see next chart). While it does not quite match the intensity of the spring restrictions, we suspect it will prove more than sufficient.
Stringency of lockdown by country

Note: As of 10/28/2020. Stringency index over time and the extent to which countries have shut down in relation to the U.S. Source: Google, University of Oxford, Apple, ECDC, UN, Macrobond, RBC GAM
U.K. stabilizing
The U.K. numbers appear to have stabilized over the past two weeks, albeit at nearly 25,000 new infections per day (see next chart). It would appear that recent tightening measures are starting to work, and in theory the case count should begin declining rapidly once the full effects of the country’s recent lockdown appear in the numbers over the coming two weeks.
COVID-19 cases and deaths in the U.K.

Note: As of 11/09/2020. 7-day moving average of daily new cases and new deaths. Source: CDC, Macrobond, RBC GAM
Canada deteriorating
While it is heartening that Canada has had the fewest cumulative COVID-19 infections on a per capita basis relative to its North American and European peers (see next chart), the situation is nevertheless deteriorating in Canada.
COVID-19 cases on a population adjusted basis

Note: As of 11/09/2020. 7-day moving average of cumulative cases per one million residents. Source: ECDC, Macrobond, RBC GAM
Canada’s virus numbers are once again deteriorating rapidly, after having appeared on track to stabilize two weeks ago (see next chart). Canada is now recording around 4,000 new infections per day, and the fatality numbers are up to around 50 per day.
COVID-19 cases and deaths in Canada

Note: As of 11/09/2020. 7-day moving average of daily new cases and new deaths. Source: CDC, Macrobond, RBC GAM
It is a frustrating situation. Even Quebec – which had been on an improving trajectory for the last month thanks to the strictest social distancing rules in the country – is now recording a rising case count again (see next chart). It is not clear what would have prompted the reversal. Should it persist, it would mean not only that Quebec needs to further tighten its social distancing, but that the rest of Canada has even more work to do than before.
Spread of COVID-19 in Quebec

Note: As of 11/08/2020. Calculated as 7-day moving average of daily cases and total cases. Source: Government of Canada, Macrobond, RBC GAM
Alberta and British Columbia are experiencing a rapid rise in cases, and Ontario’s caseload is edging higher. Ominously, parts of Ontario are now lightening their social restrictions even as the virus spreads ever-more rapidly. This is unlikely to end well.
Strangely, Canada’s daily testing has declined slightly, even as the number of infected has grown. As such, whereas Canada boasted a mere 1% positive test rate over the summer, that has now ballooned to 7% (see next chart). This hints that many positive cases are probably being missed.
COVID-19 diagnostic testing in Canada

Note: As of 11/09/2020. Positive rate calculated as 3-day moving average of new cases / new tests. Source: Our World in Data, ECDC, Macrobond, RBC GAM
U.S. now deteriorating rapidly
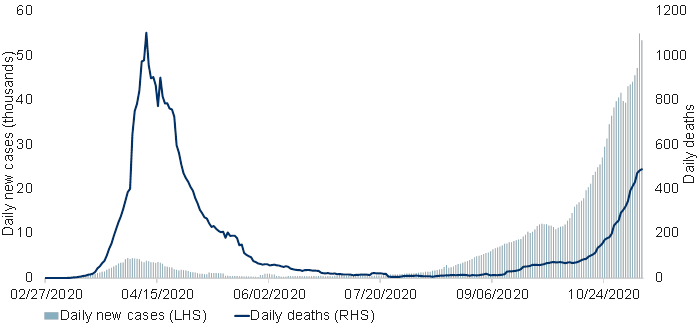
As predicted, the combination of looser social distancing rules and an expanding global pandemic have now ignited a surge of new U.S. COVID-19 cases (see next chart). The U.S. now records more than 100,000 new infections per day, having roughly doubled its daily tally over the past several weeks, and is seemingly on track to double again over the coming weeks.
COVID-19 cases and deaths in the U.S.

Note: As of 11/09/2020. 7-day moving average of daily new cases and new deaths. Source: CDC, Macrobond, RBC GAM
It remains a relief that U.S. fatalities have only edged slightly higher so far. However, these are likely to rise significantly further in the coming month.
Fortunately, some U.S. jurisdictions are now beginning to tighten their social distancing rules, including a new mask mandate in Utah. But these actions are sporadic so far, and seem insufficient given Europe’s struggles even as it implements considerably greater social distancing restrictions.
Virus spread
Data remains patchy with regard to where COVID-19 is spreading the most.
Workplaces
A Quebec study finds that 29% of the spread is happening via workplace outbreaks. The most affected workplaces are manufacturing, retail and restaurants & accommodation. While a significant fraction of the total, this is far from the majority. Indeed, a tentative unstated conclusion in many such reports is that a significant fraction of transmission must be happening at home or in a private social setting.
Restaurants
Assorted Ontario data argues that restaurants are responsible for between around 3% and 15% of outbreaks in the province, depending on the region. This may sound low, but it is not trivial given that the average person doesn’t spend a lot of time in restaurants.
Fascinating research from the University of Warwick found that the U.K. stimulus program called “Eat Out to Help Out” – which effectively provided half-price dining across the country for a month – was associated with between 8% and 17% of all new infection clusters during the period that the program was running. While the program was successful at reviving the restaurant sector, it also revved up the virus – not the mark of a successful pandemic stimulus program.
Schools
The research continues to be quite mixed on whether schools are significant sources of virus transmission or not. On the negative side, a recent study from the University of Edinburgh found that the return of children to classrooms was associated with a 24% increase in the transmission rate.
Researchers recently arrived at a similar conclusion for Quebec, when they noted that the age 10 to 19 group had experienced by far the greatest increase in infections since the beginning of school. Of course, this group is likely being tested disproportionately given school rules when certain symptoms arise or when a classmate contracts the illness. This may simply surface more cases than in the rest of the population.
Recent data from Ontario finds that schools and daycares are associated with around 20% to 40% of all recent COVID-19 outbreaks. This is quite a large share.
However, a major ongoing U.S. study continues to insist that students are less likely to be infected than the general population, with 8 new daily infections per 100,000 students, versus a general population rate of 10 infections per 100,000 people. Furthermore, the rate of infection among in-school students appears to be actively declining even as it is rising in the general population. However, this study has received criticism since schools are voluntarily participating, and those that are sufficiently pro-active to participate in a COVID-19 study are probably also making a serious effort to comply with social distancing rules.
Another study by Yale University of 57,000 childcare workers found no difference in the rate of infection between those physically caring for children and those who opted to remain at home. Of course, young children in daycare are thought to be less likely to transmit the virus.
Furthermore, one might imagine that it is easier to identify instances of transmission in a school setting in which the same students are in proximity to one another day after day. Conversely, transmission in a retail store might go undetected to the extent the customers don’t know each other and are uncertain when or where they contracted the disease. As such, school transmission may be exaggerated as a fraction of the total.
In conclusion, the data are quite mixed. Several prominent studies argue that the rate of infection is little different or even better than the general population. However, other sources argue that schools are a significant source of transmission. Of course, with millions of students, high student density and hours of continual close contact, it seems inevitable that some spread would occur.
A further big question is the extent to which this spread is acceptable. Recent research from Evercore ISI (International Strategy and Investment) emphasizes the economic costs of closing schools. In the U.S., they figure that 4.6 million full-time equivalent jobs were lost by mothers due to school closures. There is a real economic cost to parents if schools are closed. And, of course, there is also an intellectual and social cost to students. No wonder policymakers have struggled so much with this decision.
Virus science
Big news
The big news in the vaccine science space is that Pfizer/BioNTech has announced that their COVID-19 vaccine candidate enjoys a remarkably high efficacy rate of more than 90%. For context, 50% is considered the minimum threshold for a vaccine to be viable, and vaccine-makers were broadly hoping to exceed the 50% to 60% mark. There had been little talk of a vaccine this effective. Out of the 44,000 participants in the study, 94 have been infected by COVID-19. We can surmise that, of these, at least 86 were in the placebo group, versus no more than 8 in the vaccine group. This is remarkable, and all the more so because vaccines for respiratory illnesses usually have a notably lower efficacy rate than for other types of illness.
Having a high efficacy rate is a big deal in that a vaccine’s efficacy in combination with its uptake determine whether herd immunity is achieved. At a 60% efficacy rate, uptake would have to be nearly 100% to achieve herd immunity – an improbable proposition. But at a 90% efficacy rate, the uptake only needs to be in the realm of 70% to achieve herd immunity, in turn meaning the virus should fade away. To be sure, 70% uptake is far from guaranteed. But it is likely achievable given the high efficacy (which will encourage more people to take it since it is quite likely to successfully protect them), the intentions we have seen in surveys, and with possible inducements from governments and perhaps requirements from employers.
For context, the fact that the Pfizer vaccine has been so successful argues that the other vaccine candidates of the same type are likely to be quite successful as well.
The vaccine candidate has not yet been approved. It still needs slightly more data, both to establish the efficacy rate more clearly and to ensure there are no serious side-effects. This is expected to be completed by late November, at which point it is likely to be approved for emergency usage. Wider availability will likely come in early 2021.
For context, the U.S. has already ordered 100 million doses from Pfizer. Canada also has a contract of uncertain size.
What about Russia?
Russia announced that it had approved the world’s first vaccine in August, and then approved a second one this fall. Does that mean the country is already racing along the path to normality? No. Russia is actually suffering a significant rise in infections. Its vaccines were really only exiting Phase Two trials when their success was prematurely announced. The first vaccine was only tested on 76 people, and three months later has still only been administered to 6,000 participants in a study. The efficacy rate is still not known and production capabilities – while significant – are expected to be on the order of 5 million doses per month (well below the level necessary to inoculate all Russians within a year).
As such, Russia has not really leapt ahead of other countries on the vaccine front. Perhaps the most useful aspect of the country’s efforts are that – if proven effective – Russia is arranging to distribute the vaccine to the developing world. This may prove an important means of getting precious vaccines beyond the developed world.
Vaccine timing
It is worth remembering that the timing on an expected vaccine has slipped a few months since the late summer. Furthermore, while the cumulative manufacturing capacity of all vaccine developers is theoretically sufficient to blanket the entire world in 2021, in practice not all vaccines will be approved. As such, it is likely that a significant fraction of the world will have to wait to be inoculated until 2022. Thus the full return to normalcy is unlikely to be a 2021 affair.
Immunity duration
While the Pfizer news is wonderful, an Imperial College study released a few weeks ago cautions that the duration of immunity may not be as long as hoped for. The study used serology data to conclude that a smaller fraction of the U.K. had COVID-19 antibodies in September than in June. Given that more people were getting sick over the intervening months, this suggests that people lose their immunity quite quickly. The decline was particularly prominent in individuals over 75 years old, as one would expect.
It remains possible that a vaccine will deliver a sufficiently large number of antibodies that protection nevertheless lasts for a year or longer (and furthermore, it is possible that protection persists thanks to trace numbers of antibodies, or T-cells or B-cells), but there is a distinct and new risk that people will have to be inoculated more than once a year. This is a logistical challenge and a costly proposition, though not insurmountable. A further concern is that repeated injections of the same vaccine could eventually create an immune response against the vaccine, rendering it ineffective.
Of course, from a vaccine-maker’s perspective, the prospect of delivering vaccines twice per year would be quite lucrative. This would incent them to continue to innovate so as to achieve an ever-more effective and enduring vaccine.
Vaccine distribution
Developed countries have increasingly sewn up the theoretical supply of vaccines being created by developed-world makers. As such, it is relevant that Russia (as per above) and also China are seeking to make their vaccines available to the developing world. Indeed, China reportedly views this “vaccine diplomacy” as an opportunity to gain significant clout with the world’s poorer nations.
A new virus strain
Mutations have played a smaller role than feared in the pandemic so far, but now a new strain of the virus has been reported on mink farms in Denmark. This has, in turn, been passed to a handful of people. This new strain appears to be less sensitive to standard COVID-19 antibodies, such that the vaccines under development might prove less effective. It is thus imperative that the strain be halted. Denmark has implemented a mass cull of the mink and also put in place a serious lockdown in the affected region.
Economic developments
Forecast revisions
We have just emerged from our quarterly internal investment summit. As part of that effort, our GDP forecasts have been tweaked.
As hinted several weeks ago, the main developments are that we have upgraded our 2020 GDP forecast for the U.S. and Canada (see next table). This was motivated by the faster-than-expected economic recovery so far, despite the fact that we anticipate only minimal economic growth over the next few months. Conversely, the Eurozone outlook has been slightly downgraded. This reflects the greater second wave challenge in Europe and the serious lockdowns that have now been implemented.
Global growth forecast 2020: Base case scenario

Note: As at 11/06/2020. Source: RBC GAM
Looking ahead to 2021, we have downgraded most forecasts (see next table). This is in significant part because, at least for North America, a larger fraction of the recovery will have already occurred in 2020. But it also reflects the possibility that the second wave will dribble into the New Year, or that a third wave will arrive next spring. U.S. fiscal stimulus may also prove somewhat smaller than first envisioned when a ‘blue wave’ was possible.
Furthermore, even with a prospective efficacy rate of 90% and the possibility of herd immunity that this entails, it will probably take into 2022 for vaccines to be fully rolled out to the developed world (let alone to emerging markets).
Note that these growth numbers are nevertheless quite good, significantly better than the normal pre-COVID-19 growth experience. And, tentatively, 2022 growth could be similarly impressive.
Global growth forecast 2021: Base case scenario

Note: As at 11/06/2020. Source: RBC GAM
Declining mobility
Our mobility indices – which combine Oxford stringency data and Google mobility data – are increasingly pointing to an outright retreat. This is most visible in Europe, where we actively expect the economy to shrink in the fourth quarter due to the second wave of the pandemic (see next chart).
Severity of lockdown varies by country

Note: Based on latest data available as of 11/03/2020. Deviation from baseline, normalised to U.S. and smoothed with a 7-day moving average. Source: Google, University of Oxford, Macrobond, RBC GAM
U.S. economic data
U.S. economic data remains consistent with ongoing economic growth, even into October. The country’s two services purchasing manager indices were flat, on average, and reflective of solid growth.
The U.S. labour market continues to make strides. October saw the addition of 638K new jobs. The unemployment rate fell from 7.9% to just 6.9%. Meanwhile, weekly jobless claims for late October managed to scratch out a further slight improvement, declining from 758K to 751K.
U.S. productivity numbers also merit some attention. After a 10.6% annualized increase in the second quarter, they managed a 4.9% increase in the third quarter. In fairness, much of the second-quarter improvement was because low productivity sectors were disproportionately shuttered by the pandemic.
Furthermore, one might imagine that some crucial but deferrable work such as maintenance or R&D was put off during the pandemic. This gives the temporary appearance of greater output per hour worked, but at the cost of long-term growth. As such, the U.S. economy probably didn’t truly cram 2.5 years’ worth of productivity growth into six months. But we are inclined to think that a shock like this does jostle loose some inefficiencies, and that some productivity gains will prove enduring. Indeed, the fact that productivity growth remained extremely good in the third quarter even as the low-productivity sectors began to return suggests this.
The latest U.S. Federal Reserve decision yielded few changes. The Fed kept its policy rate unchanged at 0.00% to 0.25%, remains committed to supporting the U.S. economy, and is still years away from a rate hike. The Fed continues to argue that more fiscal stimulus would be appropriate.
Canadian data
Canada’s Markit Manufacturing PMI fell from 56.0 to 55.5, but is still consistent with solid growth in October. That said, recall that the country’s similar CFIB (Canadian Federation of Independent Business) index fell more precipitously when released last week. At the same time, Canada’s latest job numbers showed a sharply reduced rate of hiring compared to the prior month (84K versus 378K). We thus suspect Canadian growth has continued to decelerate into mid-autumn.
Other countries
Eurozone retail sales fell 2.0% in September. This is a bad outcome and hints of second-wave economic damage. That said, August had managed unusually good growth that was probably unsustainable. We suspect retail sales will struggle to grow in October and then decline in November.
In the U.K., the Bank of England opted to increase its quantitative easing program by another 50 billion pounds. This decision was motivated by the combination of a serious second wave, new economic restrictions and looming Brexit at the end of the year.
Fiscal outlook
Last month, the IMF (International Monetary Fund) published its latest Fiscal Monitor. A few figures are worth sharing:
- The Fund estimates that global fiscal support delivered through mid-September sums to an unfathomable $11.7 trillion, or nearly 12% of world GDP. This is far more support than was provided during and after the global financial crisis.
- Accordingly, and reflecting the fact that many governments were already in deficit before the arrival of COVID-19, the global fiscal deficit is forecast to reach 12.7% of GDP in 2020. For developed countries, this is expected to be even greater: 14.4% of GDP.
- Between 2019 and 2022, this should take developed-world public debt-to-GDP from an already-high 105% to a rarefied 126%. Ultra-low interest rates keep this affordable for the immediate future.
U.S. fiscal cliff math
We have noted in past #MacroMemos that the U.S. fiscal cliff – the reduction in policy support over the past several months – has not done as much damage as feared. This is mainly because the fiscal multiplier was unusually low in the spring. In other words, the money spent helped economies less than normal, with the implication that the withdrawal of that support should hurt economies less than normal.
Put in plain English, households saved much of the extra money the government sent them, rather than spend it. In fact, at its peak, U.S. household savings were running more than $100 billion per month higher than normal. In turn, money market funds and chequable deposits in the U.S. are about $1 trillion larger than they were before the pandemic. This can be thought of as a buffer against future trouble, keeping households from running out of money even as government support now fades.
Canada’s fiscal experience
Canada’s fiscal experience – while sharing the same contours as its peers – is nevertheless notable. For instance, the IMF projects that Canada will have the largest fiscal deficit among major nations in 2020 – an enormous 19.9% of GDP. In comparison, the U.S. is on track for 18.7%, the U.K. is tracking 16.5%, Japan should hit 14.2% and the most generous major Eurozone country (Spain) is tracking 14.1%.
Canada appears set to reap some benefits from this largesse. The IMF projects that Canada will have the smallest output gap among its peers by 2022—2023.
Nevertheless, given that Canada has experienced one of the least intense COVID-19 outbreaks on a per capita basis, the country has been extraordinarily generous with its fiscal support. By extension, Canada’s federal debt will increase by more than most. It will rise from 31% of GDP pre-pandemic to 48% by 2021—2022, according to the Parliamentary Budget Office.
Canada is lucky to have started from a fairly healthy fiscal position, or this leap might have proven problematic. Canada’s fiscal capacity is not infinite and the relatively low fiscal multiplier achieved on many pandemic programs argues that the money is not being deployed at maximum efficiency. Ultra-low interest rates make this spending easier to afford than usual. But to the extent the debt is unlikely to be paid off any time soon, it will have to be serviced indefinitely, including during the distant future when interest rates may not be so low.
-With contributions from Vivien Lee and Kiki Oyerinde
Interested in more insights from Eric Lascelles and other RBC GAM thought leaders? Read more insights now.