Overview
This week’s #MacroMemo covers the usual subjects, starting with the latest infection numbers, the pace of reopening and vaccination news. It also wades into fresh economic data, discusses the increase in bond yields, evaluates Canadian competitiveness and highlights low probability-high impact risks.
Overall, recent developments remain more positive than negative. Key positives include the rapid rate of vaccination and surprisingly good economic data. Conversely, important negatives include the recent stagnation of COVID-19 infection numbers and new concerns about rising borrowing costs.
Virus developments
The global COVID-19 infection trend remains enormously improved relative to two months ago, managing a 52% cumulative drop in the daily case rate (see next chart). However, the numbers are no longer declining – a theme that has solidified in many countries over the past few weeks.
Global COVID-19 cases and deaths

As of 03/07/2021. 7-day moving average of daily new cases and new deaths. Source: WHO, Macrobond, RBC GAM
By extension, the global transmission rate has now bounced off of its lowest reading since the onset of the pandemic and is back to a reading of one. This is precisely on the threshold between an improving and a deteriorating trend (see next chart).
Global transmission rate hovering around key threshold of one

As of 03/07/2021. Transmission rate calculated as a 7-day change of underlying 7-day moving average smoothed by a 14-day moving average of new daily cases. Source: WHO, Macrobond, RBC GAM
Six of the seven emerging market countries with the greatest number of infections per capita are now suffering a worsening trend, namely Hungary, Poland, Brazil, Chile, Argentina and Turkey.
Developed countries are holding onto their gains somewhat better, but also seemingly inflecting. The U.S. infection numbers have fallen beautifully since early January, and are now down 76%. But the rate of improvement has slowed to a crawl (see next chart).
COVID-19 cases and deaths in the U.S.

As of 03/07/2021. 7-day moving average of daily new cases and new deaths. Source: WHO, Macrobond, RBC GAM
The majority of U.S. states are still managing to reduce their infections, but 10 are now experiencing rising infections again – up from none at the end of February (see next chart). It is unclear whether this presages more states deteriorating or not, but it is a risk.
Transmission rate, U.S. states

As of 03/07/2021. Transmission rate calculated as 7-day change of underlying 5-day moving average of new daily cases, smoothed with 7-day moving average. States above dotted line at 1 have increasing new daily cases. Includes Washington, D.C. Source: The COVID Tracking Project, Macrobond, RBC GAM
In Canada, the number of daily infections stopped falling significantly a few weeks ago (see next chart). Fatalities continue to drop, presumably in part because of the standard one-month lag from infections to deaths, and in part because vaccinations should be reducing mortality rates as well.
COVID-19 cases and deaths in Canada

As of 03/07/2021. 7-day moving average of daily new cases and new deaths. Source: WHO, Macrobond, RBC GAM
The infection numbers are actively rising in some developed countries. Germany continues to suffer a slight deterioration, while Italy is now recording a sudden and significant infection spike (see next chart).
COVID-19 cases and deaths in Italy

As of 03/07/2021. 7-day moving average of daily new cases and new deaths. Source: WHO, Macrobond, RBC GAM
Is a new infection wave coming?
There is a good likelihood that another virus wave will arrive over the next month or two. As just discussed, the raw infection numbers have ceased to significantly improve in many jurisdictions, and have even begun deteriorating in others. Yet, as discussed later, politicians are beginning to reopen their economies – a potential catalyst for more infections.
Wastewater analysis provides an early, albeit volatile, look at the spread of the virus. Canada’s best data arguably comes from Ottawa, and the latest virus numbers are rising briskly.
Several new virus variants are more contagious than the original form of the virus. These should theoretically capture an increasing share of total infections over time. What was initially sufficient social distancing for the original version of the virus may prove to be insufficient against the new variants.
Indeed, while the data is still patchy, it seems clear that the number of variant-based infections is accelerating. For instance, in the U.S., 22% of all recorded variant cases were identified over the past week alone. In Canada, a startling 41% of all variant cases were recorded over the past week. Granted, governments are testing for the variants more than they were a few months ago. This distorts the findings somewhat. But even with this knowledge, it is hard to interpret these figures in a way that does not suggest a rapidly rising number of variant infections.
Lastly, the number of cases in Brazil – home of perhaps the most concerning variant – is now spiking and setting new records (see next chart).
COVID-19 cases and deaths in Brazil

As of 03/07/2021. 7-day moving average of daily new cases and new deaths. Source: WHO, Macrobond, RBC GAM
Fortunately, even if the developed world does experience another infection wave, it is unlikely to prove as problematic as the prior waves. Crucially, hospitalizations and fatalities should remain significantly lower given the pace at which the most vulnerable people are being inoculated. In addition, we have been pleasantly surprised by how little economic damage was done by the second wave, and furthermore that financial markets were barely swayed. In turn, future waves will not necessarily have an outsized effect on the economy or financial markets.
It should also be noted that another wave – while seemingly likely – isn’t quite certain. Ireland, Slovakia, Denmark and South Africa were all inundated by new, more problematic variants and yet have kept their infections in check or even reduced them (see South Africa on next chart).
COVID-19 cases and deaths in South Africa

As of 03/07/2021. 7-day moving average of daily new cases and new deaths. Source: WHO, Macrobond, RBC GAM
In Canada, Newfoundland is well on its way to quelling its recent outbreak of U.K. variant infections (see next chart). We had initially been concerned that its minimal experience with the virus since last spring might make it worse equipped than most to pivot toward stricter rules, but this hypothesis was wrong: it has actually done quite nicely.
Spread of COVID-19 in Newfoundland

As of 03/07/2021. Calculated as 7-day moving average of daily cases and total cases. Source: Government of Canada, Macrobond, RBC GAM
Finally, new research increasingly shows that the existing suite of vaccines should actually do a reasonable job combatting the South African and Brazilian variants, despite the additional challenges therein.
To be clear, we continue to assume there will be another infection wave over the next few months, but it may be less intense than in the past, and the prognosis isn’t certain.
Reopening gains steam
Politicians continue to significantly ease social-distancing restrictions (see next chart). Our global measure argues that recent moves have reversed nearly half of the tightening that occurred since last September. The glass-half-full perspective on this is that it should enable an economic resurgence over the coming month. The glass-half-empty perspective is that it may allow a further wave of infections given the simultaneous spread of new virus variants.
Global Stringency Index

As of 03/07/2021. Global Stringency Index measuring the strictness of lockdown policies that restrict mobility, calculated as stringency index of 50 largest economies. Sources: University of Oxford, International Monetary Fund, Macrobond, GAM
Texas is proving particularly enthusiastic in its reopening. The state has removed virtually all restrictions, including its mask policy, in response to admittedly enviable falling hospitalization and fatality rates (see next chart). Many Texas businesses are still choosing to impose certain restrictions on customers and employees, but it is nevertheless a significant policy pivot. The state merits close watching over the coming weeks to see whether the shift has any effect on virus spread. Any interpretation will, of course, be blurred by the significant vaccination progress being made across the U.S. at the same time.
State of Texas

As of 03/07/2021. 7-day moving average of daily new deaths used as trendline. Source: The COVID Tracking Project, Macrobond, RBC GAM
Representing something of an opposite extreme, the U.K. remains quite slow in reopening its economy. The nation has made great progress in its vaccination campaign and seen a sharp decline in infections and fatalities over the past few months. Yet the U.K. is only now reopening its schools and will delay a significant part of the normalization until June. In theory, its infection, hospitalization and fatality figures should collapse under this strategy, and it would not be a surprise if the government ultimately opts to bring forward some of the reopening plans.
Vaccination news
Vaccination progress
Vaccination progress continues to impress (see next table). More than 304 million shots have now been administered globally, spanning 114 countries.
COVID-19 global vaccine ranking

As of 03/07/2021. Cumulative total doses administered by country per 100 people. Source: Our World in Data, Macrobond, RBC GAM
Israel maintains its considerable lead, having now delivered 100 doses per 100 people. Recall that most vaccines require two doses, meaning the country is roughly half way toward inoculating its entire population. Given that children are presently excluded from the vaccination campaign, it is fair to describe Israel as around two-thirds done its adult population.
Among large wealthy nations, the U.K. and U.S. continue to lead, with 34 and 26 doses per 100 people, respectively. Europe has now advanced to the 8—10 range, with Canada lagging at 6 doses per 100 people. Canada recently announced that Pfizer will deliver more doses than previously planned over the coming months, helping the country to partially catch up.
China nears 4 doses per 100 people, India is up to 1.5 and Japan’s journey has only just begun.
The pace of vaccination is clearly picking up (see next chart). Optimism is rising about future progress as well. Whereas back in December one betting market had assigned just a 25% chance that two-thirds of Americans would be inoculated by the middle of the year, this was then upgraded to a 75% chance two weeks later. That number has now soared to a 95% chance.
Coronavirus vaccine doses administered
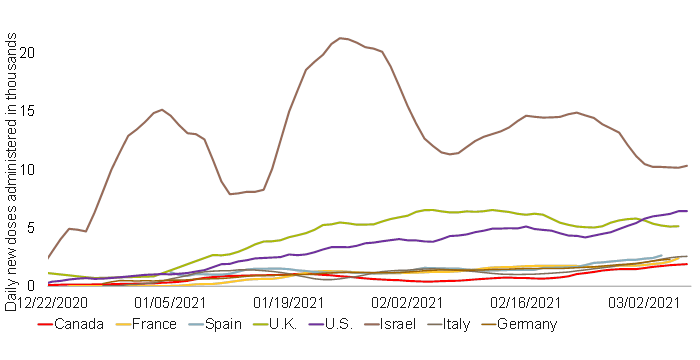
As of 03/07/2021. 7-day moving average number of new daily coronavirus vaccine doses administered per million. Source: Our World in Data, Macrobond, RBC GAM
Approvals
The Johnson & Johnson vaccine has now been approved by both the U.S. and Canada. While its efficacy rate of 66% is underwhelming compared to some of the others, it has nevertheless been quite effective at minimizing hospitalizations and deaths.
While there is still some concern about using the AstraZeneca vaccine on older adults, the World Health Organization recently approved its use for all adults.
AstraZeneca has also begun developing a new shot that will target the South African variant, but it won’t be available until the fall.
Increased supply
The supply outlook continues to improve for vaccines. This is not just because of additional vaccine approvals, but also because production partnerships continue to be struck to increase the supply of vaccines. Merck and Sanofi will now help produce the Johnson & Johnson vaccine, while Sanofi and Novartis will help make the Pfizer vaccine.
Furthermore, more countries are embracing the strategy of delaying the second shot for several months, allowing more people to obtain partial protection. As we discussed two weeks ago, this appears to be the correct strategy to minimize the loss of human life.
Vaccine nationalism revives
Unfortunately, concerns about vaccine nationalism are rising again. Italy blocked the export of vaccines to Australia, with France approving the decision and the EU remaining silent. This raises questions and concerns for the many countries that lack domestic vaccine manufacturing capacity, including Canada. Fortunately, it may prove to be a special case, as Italy has said it did this because Australia is not a “country in need” due to its near-eradication of the virus. Few other countries can claim as much success as Australia, and so presumably few are at risk of having their vaccine imports blocked. Nevertheless, it highlights a fissure that could deepen were the infection numbers to begin rising significantly again.
Herd immunity after all?
Not long ago, we flagged the distinct risk that herd immunity proves elusive, for a number of reasons:
- It is nearly impossible to achieve an immunity rate of 75% when children cannot be inoculated.
- Vaccine efficacy rates remain below 100%.
- There is a risk that efficacy rates may fall further should certain variants take over.
However, recent news has increased our optimism on the subject. Tests are now being conducted on younger people. It seems increasingly likely that children will ultimately be vaccinated, much as they are vaccinated against many other viruses. Similarly, efforts are now underway to produce boosters that increase the efficacy of vaccines against new variants. Should both of these pushes bear fruit, it seems conceivable that herd immunity might be achieved in 2022.
Economic developments
Economic data continues to impress, with few exceptions.
Canada avoids contraction
In Canada, fourth-quarter GDP landed with a big 9.6% annualized increase. Even more impressive, not only did December defy expectations with a (small) 0.1% gain, but the flash reading for January uncovered a further 0.5% gain. To the extent that economic conditions likely revived further in February (the CFIB business barometer for that month rose from 58.7 to a strong 62.5 – its highest reading in nearly three years), it would appear that Canada survived the second virus wave without a single month of decline.
This isn’t to say that the second wave was painless – two months of job losses argue otherwise. But it was considerably milder than feared. Going into the second wave, we had played up the idea that the damage should be literally an order of magnitude less than last spring, but it has proven to be even slighter than that. The economy is now running materially ahead of the Bank of Canada’s own forecast – one factor in the recent bond market sell-off.
Real-time economic data also argues the Canadian economy is managing at least a slight rebound in the latest month (see next chart).
Canadian businesses start to reopen after second round of lockdown

As of 02/08/2021. Source: CFIB, RBC GAM
U.S. data also strong
U.S. personal income grew by a remarkable 10% in January relative to the month before. Let us recognize that this was in significant part due to the $600 checks distributed to many Americans alongside other support from the $900 billion fiscal stimulus package passed at the end of December. Nevertheless, it provides a very real jolt of income.
Some of that money was then converted into spending, with personal spending up 2.4% in January. The incomplete deployment of the additional spending could be argued as evidence of a low fiscal multiplier, but it is probably more accurate to recognize that the fiscal largesse has increased the U.S. household financial buffer against future problems, and will probably continue to trickle out in future months, helping to avoid a later fiscal cliff.
The U.S. is also back to robust job creation, adding 379,000 new positions in February. Of these, a remarkable 355,000 were in the beleaguered leisure and hospitality sector. The unemployment rate fell further, to 6.2%. The twin ISM (Institute for Supply Management) reports were also robust:
- The manufacturing index rose from 58.7 to a very strong 60.8.
- The services index went down from 58.7 to 55.3, but still consistent with moderate growth in service-oriented sectors.
That said, one yellow flag is that the prices paid index in the manufacturing survey has now increased to 86. It was higher in 2008 and has occasionally touched these levels in the past. But this is undeniably a high reading and means that businesses are encountering more input inflation.
Amazingly, the U.S. isn’t done with fiscal stimulus. It now appears that President Biden’s proposed $1.9 trillion package may be delivered in full, having already passed the Senate and seemingly having fewer obstacles in the House of Representatives. We had assumed the size would be $1.5 trillion just two weeks ago, and had initially imagined it might “only” be $1.0 trillion a month ago. Suffice it to say that the U.S. will have a lot of money sloshing around over the coming months. We suspect it is a bit too large relative to the economic hole that remains to be filled. This raises some short-term inflation risks and – of course – permanently increases the public debt load.
Our real-time U.S. economic activity index shows the temporary effect of the winter storm that gripped much of the country recently (see next chart). We expect a complete and rapid reversal.
U.S. economic activity declined temporarily due to winter storm in the south

As of 02/20/2021. Economic Activity Index is the average of nine high-frequency economic data series measuring the year-over-year percentage change. Source: Bank of America, Goldman Sachs, OpenTable, Macrobond, RBC GAM
Europe continues to do worse
In contrast to relatively sprightly North American economies, Eurozone economic activity remains much weaker. The second virus wave has done considerable damage. For example:
- Eurozone retail sales fell 5.9% in January.
- The Eurozone unemployment rate now sits at 8.1% – nearly two points higher than the U.S., despite many European workers remaining on payrolls but actually furloughed.
Unequal recovery
The pandemic has had a highly varied effect on workers. Many have been barely impacted other than having pivoted toward remote working. Others continue to work in the usual environment but with additional risks to their health. Still others lost their jobs altogether.
Low-wage workers have fared particularly poorly, mainly because they include workers in many of the service sectors that were most adversely affected by social distancing rules. Canadian employment among low-wage workers is nearly 30% below pre-pandemic norms. Other workers have seen only a slight decline in their employment (see next chart).
Low-wage workers more vulnerable to COVID restrictions

As of Jan 2021. Low wage defined as median employee wage less than or equal to $16.10/hour (two-thirds of 2019 median hourly wage of $24.15). Source: Statistics Canada, RBC GAM
From a fiscal policy perspective, it is obviously imperative that the most adversely affected workers be supported. This has broadly happened.
The trend has also captured the attention of central bankers. It is clear that central bankers should deliver more stimulative monetary policy when the overall economy is underperforming. What is less clear is how they should respond when particular subgroups underperform.
Every recession burdens some groups more than others. The financial crisis hurt construction and manufacturing workers more than other sectors, for instance. Do interest rates need to fall more when one particular group is doing worse than the average -- even though that means, by definition, that another group must be doing better than the average? The granular differences would only seem to be relevant if one group is known to have more responsive wages than the other, or some other asymmetry exists that implies the inflation outlook is altered by the dynamic. It isn’t clear that this is the case.
Birth dearth
A year ago, we speculated that there might be fewer births as a result of the pandemic. This prediction is now proving true as 2020 birth statistics are published. Chinese births have fallen by 15% relative to the year before. While China’s birth rate was already in structural decline, this was an outsized drop. The figures are similar elsewhere:
- Japanese births fell 9.3%.
- Florida births declined by 7.2%.
- California births fell by 10.5%.
- Italian births dropped by a huge 21.6%.
It is important to recognize that birth rates usually decline during recessions, so this is not purely a function of the pandemic. Nevertheless, births do not normally fall this far during a recession. However, it makes sense that a pandemic should further reduce births, as couples might be reluctant to have a baby at a dangerous time.
We suspect some part of the loss will be reclaimed in subsequent years. Many affected couples will have a child later. But some permanent loss is likely, albeit slight relative to the size of the global population.
Higher yields
Bond yields have increased sharply since last summer. The U.S. 10-year yield has more than tripled, rising from 0.51% in August to 1.60% today. Of course, one might also say that the yield has risen by a bit more than a percentage point – a notable move, to be sure, but hardly unprecedented. Either way, while bond yields are still very low, they are materially less so than seven months ago.
The initial part of the increase in yields was primarily based on rising inflation expectations. More recently, it has been real yields that have increased. There is logic behind both moves.
Inflation is indeed rising. Commodity prices have leapt higher. And, there is the undeniable risk of more inflation given all of the money that has been printed, plus the prospect of yet-more fiscal stimulus in the U.S.
Simultaneously, economic growth continues to exceed expectations. The pace of vaccinations promise more of the same, even before the next round of fiscal stimulus is implemented.
This move has certainly been notable to fixed income investors, and similarly for borrowers. Crucially, however, our one-year out forecasts are for interest rates to remain at current levels or event to retreat somewhat.
Inflation is rising and there are some upside risks, but it is unlikely to become a major problem in a world with high unemployment and an aging population.
Real rates have justifiably risen, but should remain low for cyclical reasons given the prospect of lingering economic slack over the next year or two, huge household savings, and major central bank bond buying. From a structural perspective, rates should also remain low. Public debt loads are now even higher than before, necessitating a sustainably lower interest rate. Indeed, what constitutes a “neutral” policy rate has fallen from perhaps 5.0% at the turn of the millennium to below 4% a decade ago, to below 3% a few years ago, to now potentially in the realm of 2% – if not lower.
From an economic standpoint, the move so far has rendered financial conditions slightly less friendly, but still leaves them more generous than at any other point in recorded history. This is unlikely to snuff out the economic recovery. One might imagine the housing market cooling slightly. But sovereign debt servicing costs should still be manageable given that rates are still quite low and the duration of sovereign debt is such that most countries will still be rolling maturing debt at a cheaper borrowing cost than before.
Canadian competitiveness
Canada has lost some business-sector competitiveness over the past two decades. For example:
- Canada was 82% as productive as the U.S. in the year 2000, whereas this has slipped to 78% today.
- The U.S. economy grew by 42% over the past 20 years, versus 40% growth in Canada.
- At the corporate level, Canada had 66 companies in the Fortune Global 2000 in the year 2005, versus 61 firms today.
- The World Economic Forum ranks Canadian competitiveness in 14th place as of 2019, down from as high as 9th over the past decade.
But these declines are fairly slight, and in several cases there are extenuating circumstances:
- It is considerably harder for Canada to compete with its current exchange rate than at the rock-bottom rate of the year 2000.
- Although Canada grew more slowly than the U.S. over two decades, it easily bested the U.K., Eurozone and Japan.
- While Canada has slightly fewer corporate titans than in the past, the real story is arguably the ascent of China and other emerging market nations that have gobbled up a rising share of the list, rather than Canada’s retreat.
- Whereas Canada now ranks lower according to the World Economic Forum, Canada has really just ping-ponged between 9th and 15th place over the years – it isn’t a narrative of steady decay.
- The ascent of technology companies is also a development that uniquely favours large countries such as the U.S. and China, given that so many tech business models are rooted in scalability and network effects.
Thus, it is fairer to say that Canada has slipped slightly against the hypercompetitive U.S. rather than that Canada is in freefall versus the world. Still, there is room for Canada to do better. Even if you believe that the productivity statistics sell Canada short – the gap compared to the U.S. is arguably exaggerated by 5 to 10 percentage points due to definitional differences. The two countries’ different sector mixes may explain a further 5 percentage points. Canada has some room for improvement to be among the best in the world.
Some of the hard work may be done for Canada as the U.S. now considers tax hikes, stricter environmental rules, more regulations and possibly a higher minimum wage under a Democratic Party administration. These forces may help to bridge the competitiveness gap to Canada that opened up over the past six years as Canada implemented similar changes. Of course, there are also unique Canadian challenges to come. For example, oil demand is expected to peak in the 2030s.
There are clear opportunities for Canada to lift its own competitiveness via better adoption of information and communication technologies, more and better-integrated research and development, building on existing tech hubs, better protection of intellectual property, less red tape, better infrastructure, fewer provincial barriers (including more internal labour mobility), less protectionism in the service sector, boosting immigration quality even higher, and returning to a culture of balanced budgets.
The sky would be the limit were these changes added to Canada’s existing roster of advantages: high-quality education and health care, good intergenerational mobility, a sound financial system, a history of fiscal prudence, excellent political stability, strong political institutions, great resource wealth, a clean environment, ample land and water, an openness to trade, proximity to the U.S., reasonable proximity to China, a diversified economy, high quality immigration and a history of successful multiculturalism.
Low probability-high impact risks
We continue to review the many long-term repercussions of COVID-19. This week, we consider the pandemic’s effect on how policymakers view low probability-high impact risks.
A low probability-high impact risk is one that is quite unlikely to happen, but when it does, it has enormous consequences. It is a matter of simple math to argue that we should care and worry as much about such risks as we do about medium probability-medium impact risks such as tumbling into a recession once every decade, or high probability-low impact risks such as the minor financial tremors that arise in one form or another nearly every year.
But, in practice, policymakers have all but ignored low probability-high impact risks. It is thus a silver lining of the pandemic – the very definition of a low probability-high impact event – that such risks will likely capture more attention going forward. Inevitably, the enthusiasm for such matters will fade somewhat as the current generation of politicians is replaced by the next, but some aspect should persist.
What are other examples of low probability-high impact risks (see next table)? These include not just a pandemic, but an asteroid strike, a nuclear war, a volcanic super-eruption, a major solar flare, or even the singularity (which envisions super-intelligent computers effectively taking over from humans as the dominant species). Some of these frankly feel silly to say out loud, but so too did talking seriously about a pandemic such as this one, until it struck.
Suffice it to say that governments would be well advised to allocate more funding not just to pandemic preparedness and prevention, but also to investigating and perhaps mitigating these other risks. Few if any are likely to trigger in our lifetimes, but they would bring unfathomable consequences if they did. Policymakers learned well from the global financial crisis, making the financial sector considerably safer than before. This is an opportunity to do the same.
Likely greater focus on mitigating low probability-high impact events – this is good

As at 02/18/2021. Source: University of Arizona, Oxford University, United States Geological Survey, Battersby, RBC GAM
-With contributions from Vivien Lee and Sean Swift
Interested in more insights from Eric Lascelles and other RBC GAM thought leaders? Read more insights now.