Global Investment Outlook
Our quarterly Global Investment Outlook is now available, with extensive analysis of the economic and financial market situation from a truly remarkable variety of angles.
Summary
The COVID-19 situation has fallen into a familiar pattern, with the same positives and negatives dominating, if further along their respective paths.
On the positive side, the economic recovery continues. Risk assets have risen further. And, there is even incrementally more hope of a medical solution.
On the negative side, the virus continues to spread, with emerging-market nations and the U.S. most adversely affected. To the extent this trend could well undermine the aforementioned economic and financial market revivals, this is a serious problem.
Virus figures
The global daily infection figures continue to mount, with a new record of nearly 180,000 cases tabulated on a recent day. The trend remains on an upward trajectory (see next chart). Roughly nine million people have now been infected, globally.
Spread of COVID-19 globally
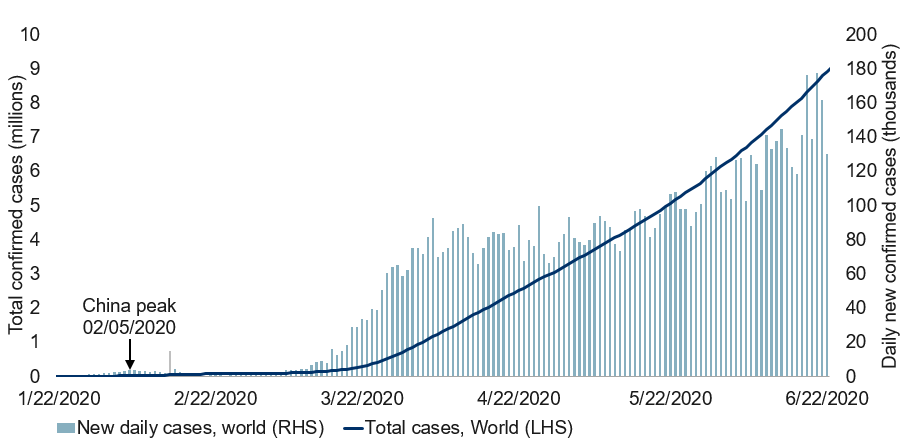
Note: As of 06/22/2020. Spike on 02/13/2020 due to methodology change. Source: ECDC, Macrobond, RBC GAM
As usual, the fatality figures don’t tell quite so dire a story. These have tended to be roughly flat over the past month, though a subtle upward trend may now be visible here, too (see next chart). Nearly half a million people have now died from COVID-19 according to official global estimates.
COVID-19 deaths globally
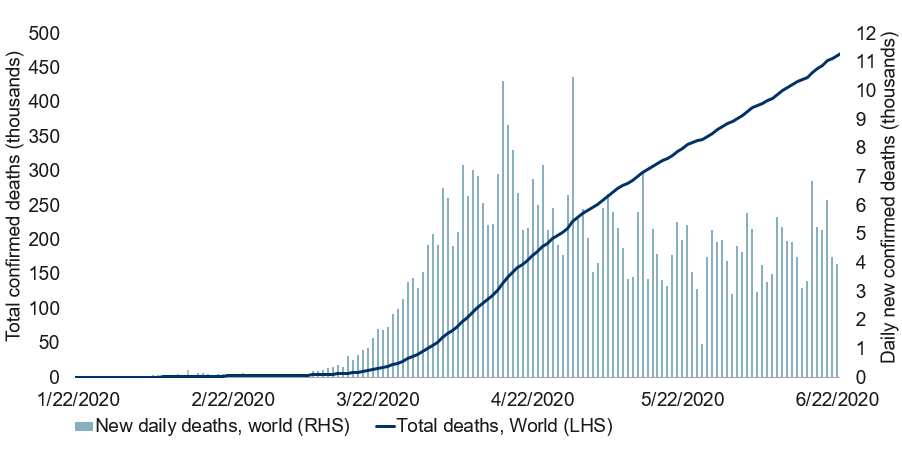
Note: As of 06/22/2020. Spike on 02/13/2020 due to methodology change. Source: ECDC, Macrobond, RBC GAM
The New York Times figures that the true number of deaths in the U.S. may be undercounted by around 15%, and there is reason to think a similar pattern applies elsewhere. Despite this, the fatality numbers are likely the more accurate (or, more precisely, less inaccurate) of the two estimation methodologies.
Geographically, emerging markets have continued to suffer the worst of the virus in recent weeks, experiencing an upward trend on a trend basis. Developed countries, conversely, had managed a generally improving trend, although this is now in question (see next chart).
COVID-19 hitting emerging market countries now
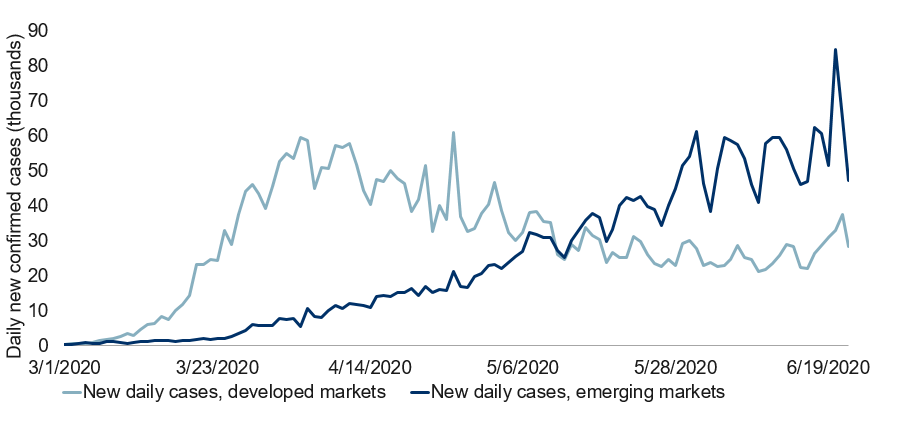
Note: As of 06/22/2020. DM aggregates case count from France, Germany, Italy, Spain, U.K. and U.S., and represents 38.6% of global cases. EM aggregates case count from Brazil, India, Iran, Peru, Russia and Turkey, and represents 30.6% of global cases. Source: ECDC, Macrobond, RBC GAM
In the developed world, the number of deaths appears to continue to fall, but the number of infections may now be rising again, disproportionately due to deterioration in the U.S. (see next chart).
New cases vs. deaths trend in developed markets
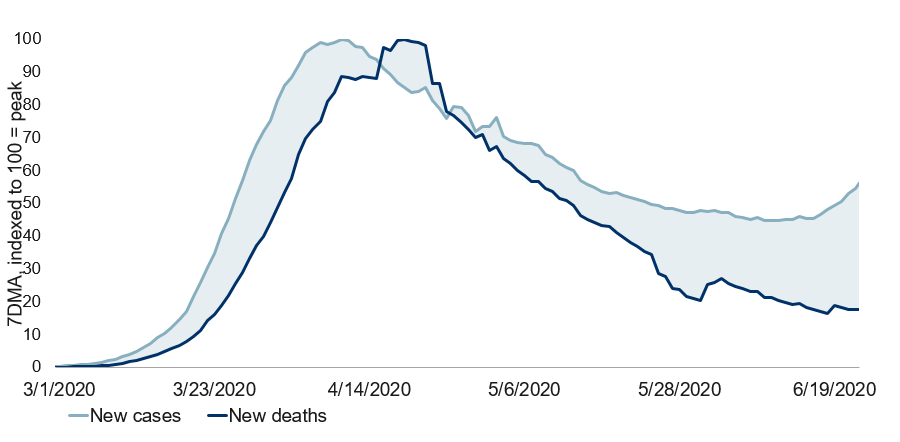
Note: As of 06/22/2020. DM aggregates cases & deaths from France, Germany, Italy, Spain, U.K. and U.S., and represents 38.6% of global cases. 7-day moving average of cases & deaths indexed to 100 = peak. Source: ECDC, Macrobond, RBC GAM
The U.S. recently recorded its worst day of infections since early May (see next chart), though the trajectory has varied enormously by state. Previous hot spots such as New York State are now doing quite well, whereas places like Texas and Florida are now encountering the virus to a far greater extent than they ever did in March, April or May.
Spread of COVID-19 in the U.S.
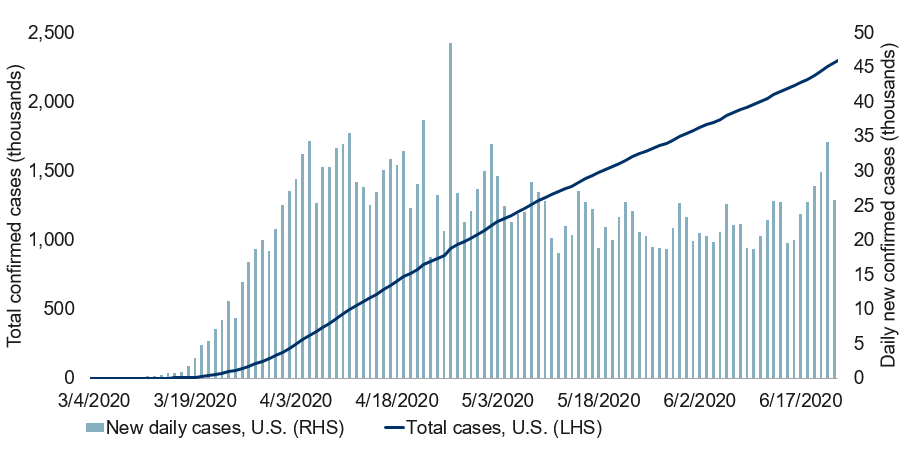
Note: As of 06/22/2020. Source: ECDC, Macrobond, RBC GAM
As with the global data, the U.S. death figures are not quite so daunting. They continue to evince a declining trend (see next chart). This is the best rebuttal against claims that the U.S. is spiraling out of control. However, it may simply be because long-term care facilities remain in lockdown, while young people (who are less likely to die from the virus) are increasingly going about their business as usual.
COVID-19 deaths in the U.S.
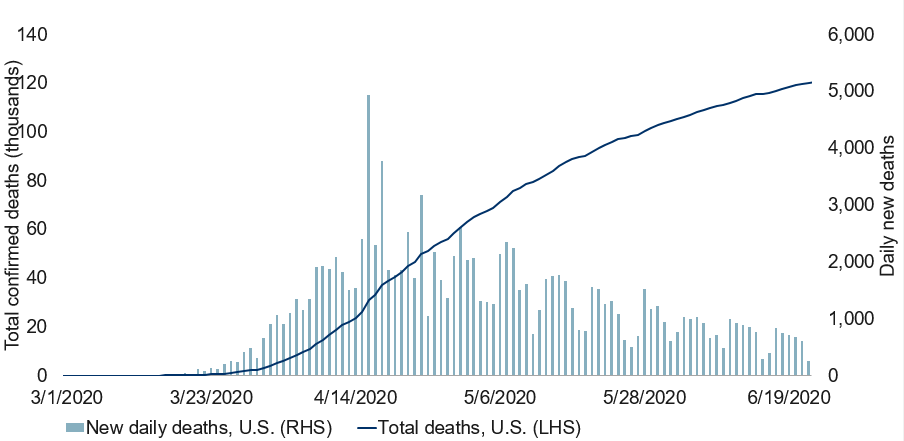
Note: As of 06/22/2020. Source: ECDC, Macrobond, RBC GAM
It is useful to occasionally revisit the international data on a per capita basis to determine which countries have experienced the most intense outbreaks (see next chart). On this front, there are few surprises. Among the major countries we track, the U.S. has had the worst of it, followed by Sweden, Spain and Brazil. Three of the four remain hotbeds for the virus, while the fourth – Spain – suffered mightily earlier, but has now succeeded in restraining the virus.
Impact of COVID-19 on a population adjusted basis
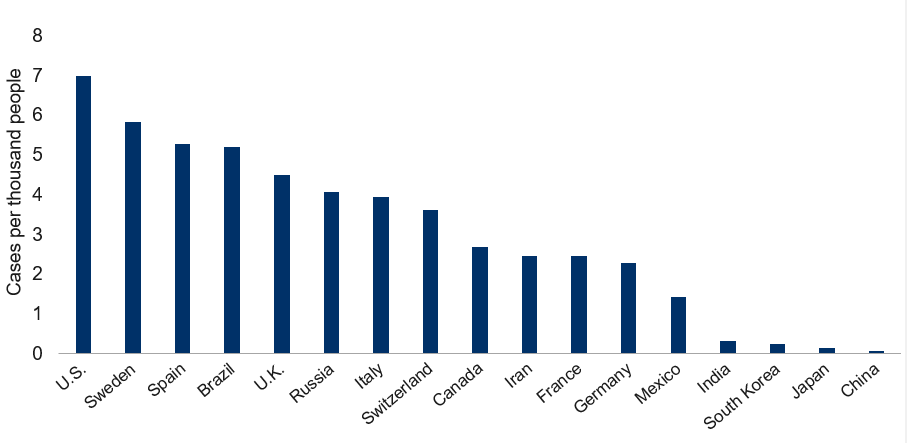
Note: As of 06/22/2020. Source: ECDC, Macrobond, RBC GAM
The U.K. infection rate has fallen significantly over the past few months, but is now seemingly stuck at around 1,000 new infections per day. Canada is looking fairly good, with only around 400 new cases per day. However, it has also ceased to make significant strides over the past week and a half, perhaps reflecting the partial normalization of activity. A variety of European countries, including France and Germany, have also driven their infection count to low levels, but are ceasing to make further headway.
Among emerging market nations, China continues to battle its mini-outbreak in Beijing, though we have confidence it will manage to corral the virus once more. India, conversely, continues to struggle, now charting 15,000 new cases per day. Some hospitals are reportedly turning away patients.
In Latin America, Brazil suffered a recent day with nearly 55,000 new cases – the all-time daily record for any country. While the country’s true trend rate is more like 25,000 to 30,000 new cases per day, this is still the worst of any nation. It is only really challenged by the U.S. Meanwhile, Chile and Peru are also struggling, with Mexico yet to control its outbreak.
Virus science
Researchers continue to uncover potential answers to many of the pressing scientific questions about COVID-19.
Early virus onset
Italy, France and Spain have conducted fascinating analyses of their waste water. They’ve concluded that COVID-19 was likely already circulating in their countries as early as December 2019 in Italy and France, and by January 2020 in Spain. In all cases, this is much earlier than previously imagined.
Fatality rate
A growing body of research continues to argue that the true fatality rate for COVID-19 is in the realm of 0.5% to 1.0% – the range we have been using since the early stages of the pandemic. At times, it was tempting to wonder whether the true rate might actually be higher given a far greater case fatality rate, but such figures are unavoidably overstated due to the many undiagnosed cases.
Sustained immunity
The water is very muddy on the subject of how immunity works with COVID-19. Scientists seem increasingly convinced that it is possible to possess at least a fleeting immunity to the virus, and reassuringly there have not been a significant number of people claiming to have been infected more than once. However, a few recent small-scale studies have hinted that people with symptoms may enjoy stronger protection than those who were asymptomatic, and further that immunity may only last a few months. These are distressing thoughts given that the majority of people who are infected may be asymptomatic, and no one wants to get multiple vaccines per year. But the science is not finalized on these subjects.
Safe distance
Although some scientists are already disputing the findings, recent research commissioned by the World Health Organization on what constitutes a safe distance argues that maintaining a one-metre distance from an infected person reduces the risk of contracting the virus from 13% to 3%. Additional distancing helps, but only slightly: expanding the distance to the classic 2 metre recommendation reduces the risk to around 1.5%. The study has been criticized for not incorporating different assumptions about the duration of contact – a no less relevant variable.
Masks
Aligning with common sense, a study now confirms that wearing masks reduces the transmission of COVID-19 – at least for hamsters! The study found that five-sixths of transmission was halted when the infected party wore a mask, while the risk of transmission fell by one-third when the uninfected party wore a mask. Wearing a mask is mostly a benevolent gesture, but there are some personal benefits.
Drug developments
The fundamental challenges of developing a medicine or cure for COVID-19 are well understood. No vaccine has ever been developed in fewer than four years. And of the 200 or so viruses that affect humans, significant treatments exist only for around 10. The others have proven intractable, or at least are not easily solved without a herculean effort.
Fortunately, a massive effort is now underway for COVID-19 on multiple fronts and in many countries. This surely helps.
One approach is to identify existing compounds that improve the prognosis for those who have already contracted the virus. On this front, there has been a major positive development in the recent announcement that a drug called Dexamethasone appears to reduce the mortality rate of those on ventilators by 33%. While this may not sound especially large, and it certainly doesn’t transform the virus from a lion into a lamb, this is a big forward step by the standards of pharmaceutical innovations. Eliminating up to a third of all COVID-19 deaths is certainly a worthy pursuit, and will likely be widely available given that the drug is quite cheap to procure.
A variety of antibody therapies are also being pursued – leveraging the antibodies of those that have already been infected to protect others – with one thought to be on track for use as early as this fall.
Finally, there are now more than 135 vaccine candidates being developed. While many are nowhere near implementation, seven have now reached Phase One trials. Another seven are in Phase Two, and one has already advanced to the final Phase Three trials. The manufacturer, in partnership with the Gates Foundation, is already ramping up production facilities to produce up to 2 billion doses by the end of 2021. This is admittedly something of a gamble as it is not yet certain that the vaccine will work, but it would be a huge leap forward if successful. Equally, even 2 billion doses will fall well short of global demand, and it is notable that even this positive scenario would leave most people without a vaccine in early 2022. Furthermore, vaccines are rarely perfect even when they do work. Success is defined as reducing the likelihood of transmission for a period of time, not rendering the recipient fully let alone permanently immune.
Economic trends
Real-time data
The mobility data we track continues to suggest an ongoing economic recovery in many countries (see next chart). By this measure, more than half of the lost activity has been recovered in the U.S. and Canada. Italy has recovered more than this, while the U.K. is lagging somewhat in its recovery.
Severity of lockdown varies by country
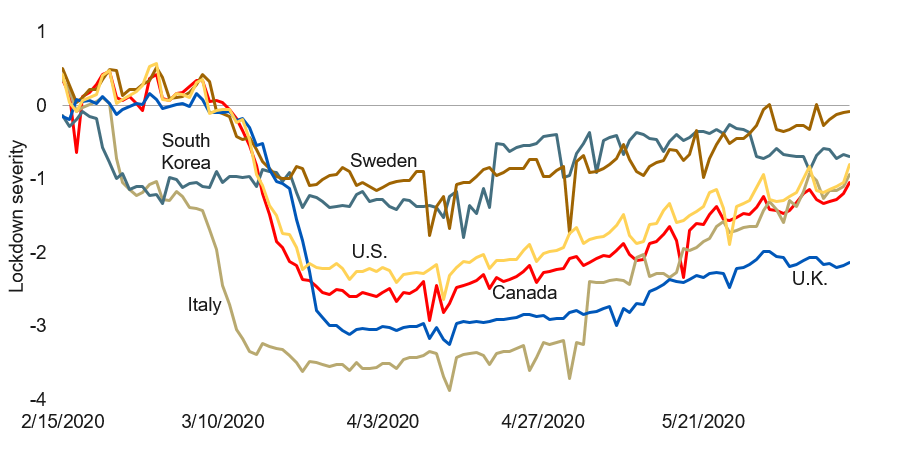
Note: As of 06/14/2020. Deviation from baseline, normalised to U.S. Source: Google, University of Oxford, Apple, Macrobond, RBC GAM
In recent weeks, we had emphasized that while the recovery was continuing, it was seemingly decelerating. This made sense – the output that is easiest to recover comes back first, with subsequent gains proving incrementally harder. This still seems like a sound theory to us, and is central to our economic forecast. But we have to concede that the latest U.S. business sales survey appears to show a significant leap higher. The sales estimate rose from 25% below normal to 20% below normal in a single week, having taken the better part of a month to recover the previous 5 percentage points (see next chart). We suspect the rate of recovery will settle down again, as we have not observed evidence of an abrupt leap higher in other data from mid-June.
New orders and sales of U.S. businesses hammered by COVID-19
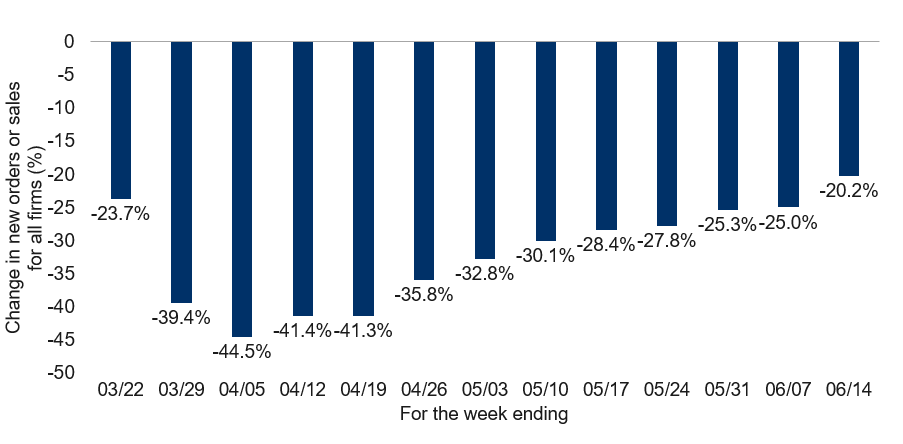
Note: Estimated as weighted average of % change in new orders or sales for all respondents. Source: Weekly Business Outlook Survey on the COVID-19 Outbreak, Federal Reserve Bank of Philadelphia, RBC GAM
Traditional data
The first tidbits of traditional economic data are now becoming available for the month of May. They confirm an economic recovery, and indeed it would appear consumers were considerably more enthusiastic than first expected. Whereas the consensus was that U.S. retail sales would revive by 8% in May, the actual increase was a remarkable 18%. This still leaves retail activity well short of the pre-COVID norm, but it is nevertheless notable that retail activity has now recovered 62% of its decline (see next chart).
U.S. economy rebounds as states reopen
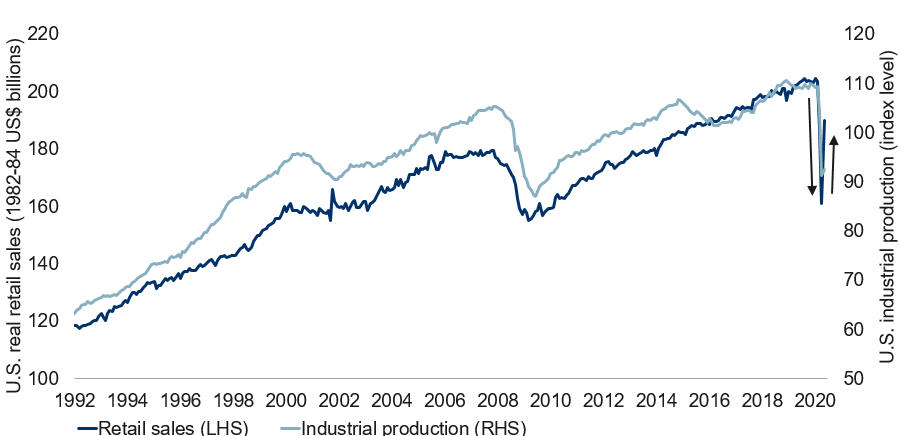
Note: As of May 2020. Source: U.S. Census Bureau, Federal Reserve, Macrobond, RBC GAM
Conversely, U.S. industrial production in May did not manage so enthusiastic a bounce, recovering by just 1%, or a mere 8% of the earlier decline (also depicted in the chart above). The manufacturing sector was responsible for the entirety of the gain, with mining and utilities languishing.
It remains fascinating that whereas China has managed a complete and enthusiastic rebound in its manufacturing sector but only a partial recovery from its consumers, the trend is very much the opposite in the U.S. In a sense, each country is playing to its strengths, with the almighty U.S. consumer proving resilient and the legendary Chinese manufacturing base doing likewise.
The National Association of Home Builders sentiment index leapt from 37 in May to 58 in June. 50 represents a neutral reading. The latest number still substantially lags the extreme optimism that prevailed in December 2019 (76), but constitutes a totally normal reading by the standards of the past decade. As such, there is reason to think that housing starts will soon rebound to match the recovery in mortgage applications. Housing markets remain surprisingly mildly affected by this episode.
American buoyancy
We remain genuinely bowled over by the extent to which Americans have resumed their normal lives despite the pandemic. This is both a testament to a resilient people but also a warning that the virus may prove harder to manage in the U.S. than elsewhere.
To be sure, economic activity is rising almost everywhere. But the fact that the U.S. hotel occupancy rate has now risen to 42% and continues to advance steadily is nothing short of startling (see next chart). This figure compares to a (surprisingly high in its own right) low of 22%, and a baseline reading of 73% in June of 2019. While the tourism sector remains well short of normal, this was widely expected to be the last sector to revive. Yet here we are with nearly half of all U.S. hotel rooms being occupied already.
U.S. hotel occupancy rate rising substantially
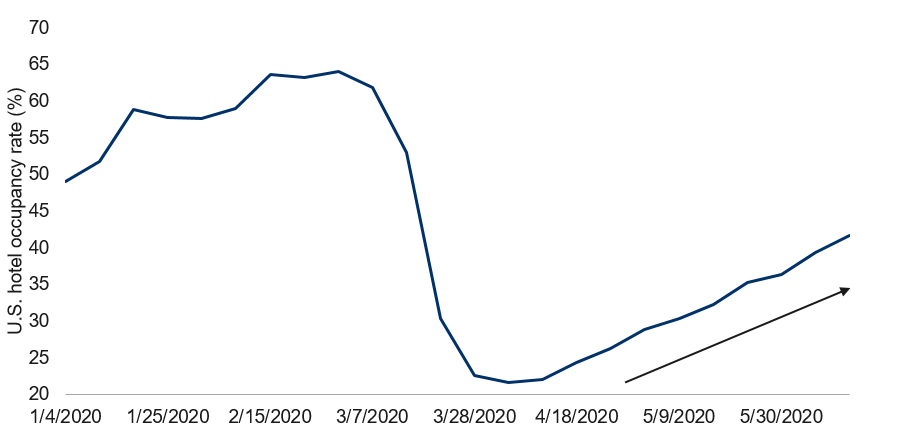
Note: For the week ending 06/13/2020. Source: STR, Wall Street Journal, RBC GAM
Disconnect
This is not a new thought, but surely the strangest economic disconnect is the fact that while economic activity overall appears to have recovered perhaps 30% to 40% of its initial decline, the labour market lags well behind. Of the 23 million additional people who found themselves receiving U.S. jobless benefits during the worst of the pandemic, only a net 4.4 million have since recovered their jobs according to the jobless claims data. In other words, the labour market has only recovered around 20% of its decline. The mismatch between the labour market and economic activity can only be resolved in one of two ways.
First, it could be that the coming few weeks will reveal a giant leap in employment. This is entirely possible, but the latest initial claims data point (which is released a week earlier than the continuing claims) doesn’t obviously point to this. Furthermore, the biggest chunk of the economic recovery had already occurred by the end of May, and the available job data captures that period already.
Second, it could be that a giant leap forward in productivity has occurred. Some of this is simply a mathematical exercise – to the extent lower paying, lower productivity jobs were shed disproportionately, the average level of productivity has logically risen. But that can’t explain the entirety of it. And it would be no small matter to manage something like a 10% to 20% jump in productivity in one fell swoop. Those sorts of gains can take up to a generation to achieve, and are normally driven by more advanced computers, better-educated workers and the like. None of this has changed substantially over the past four months. It could be that working from home and online shopping have yielded massive productivity gains, but it would be truly remarkable if such easy prosperity gains had been available all along, waiting to be triggered by a virus of all things.
In any event, we don’t have a perfect answer for the disconnect. It is likely due to a bit of everything. The June payrolls data should reveal more about the mix of drivers.
Canadian weakness
Canadian economic data is generally released with a greater lag than the U.S. In the present context, this makes Canada look particularly bad, as the country is reporting April data (the worst month of the pandemic) at the same time that the U.S. is reporting May data (when the recovery was taking hold).
Despite this optical illusion to Canada’s disadvantage, the April data is proving genuinely horrible. Retail sales fell by a colossal 26%, after having fallen by 10% in March. This is a cumulative 34% decline – far worse than the equivalent 22% peak-to-trough decline in the U.S.
Canadian wholesale trade was nearly as bad, down 22% in April. With both retail and wholesale trade, the actual outcome was roughly 10 percentage points worse than the consensus. In turn, one worries that Canadian GDP in April could prove worse than the -11% flash estimate furnished by the statistical agency at the end of May.
Fortunately, Statistics Canada has indicated that retail sales in May are tracking a 19% rebound. However, as impressive as this sounds, the low starting point implies that Canadian retail activity in May might be no better (as a fraction of their respective “normal”) than the U.S. in April.
Repo man
Normally, such industries as pawn shops and repossessors thrive during economic downturns because people are strapped for cash and frequently default on loans. However, this has proven to be a very different recession. In part, this is because its origins are not in economic excesses but rather a virus, and in large part it’s due to generous government support for households.
A few weeks ago, we wrote about how pawn shops have seen their business shrivel as some low-income households have ended up earning more money than they did before the crisis. This time, news comes from the realm of the fabled “repo man” – the people tasked with repossessing an asset that has been defaulted upon. The Wall Street Journal reports that activity has slowed sharply in that sector, too, suggesting household finances are not deteriorating as much as originally feared.
This actually points to another risk that could interfere with the economic recovery. Not only is there the obvious risk that economic activity might have to be shuttered once more as a second wave of infections takes hold in some places (discussed shortly). But it is also worth dwelling for a moment on the fact that the recovery so far is far from organic. It has been supported by giant government cheques. Even if the stimulus is only withdrawn gradually – avoiding the much-feared fiscal cliff – we have yet to establish if economic activity can be sustained under more normal conditions. For the moment, spending looks good, but businesses have been reluctant to hire. Businesses will have to hire for spending to hold up sustainably.
Second wave risk
Building upon work we shared over the past few weeks, we present our latest thinking on which countries are most at risk of suffering the continued spread of COVID-19 (see next chart). Unsurprisingly, the three most vulnerable nations are Sweden, the U.S. and Brazil. Why? The first country did not restrict activity as much as its peers, the U.S. has reopened prematurely, and Brazil has struggled to handle the virus from the beginning.
Likelihood of COVID-19 spread based on lockdown severity and current transmission rates
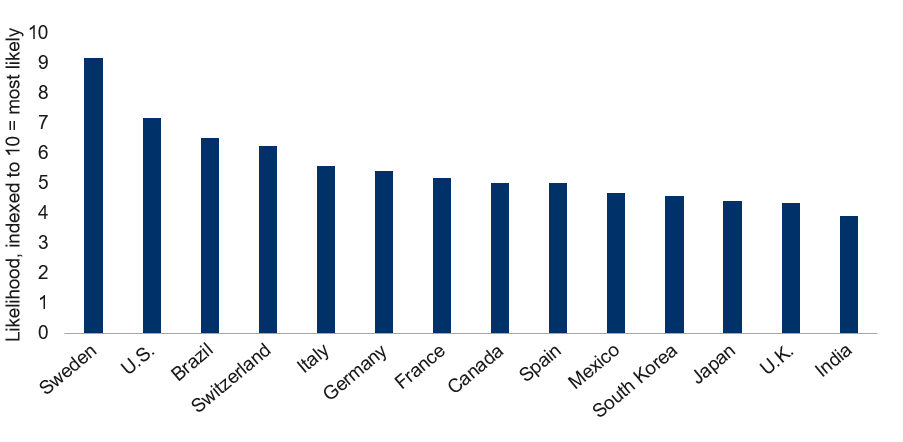
Note: As of 06/12/2020. Likelihood factors in lockdown severity and amount restrictions eased, transmission rate, and population adjusted prevalence of COVID-19. Source: Google, University of Oxford, Apple, ECDC, UN, Macrobond, RBC GAM
We have now extended this analysis to U.S. states given the fact that the majority of them (29 out of 50 states plus Washington DC) are suffering a transmission rate higher than one (see next chart).
Number of U.S. states with transmission rate above key threshold of one
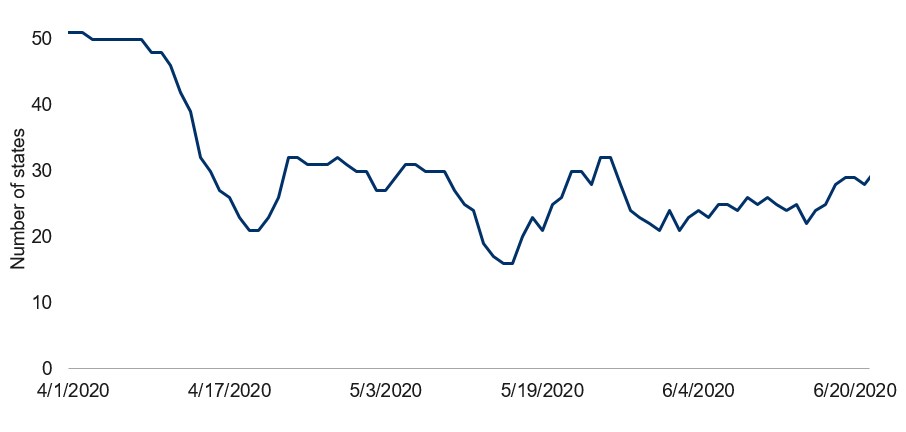
Note: As of 06/21/2020. Transmission rate calculated as 7-day change of underlying 5-day moving average of new daily cases, smoothed with 7-day moving average. Transmission rate above one suggests increasing new daily cases. Includes Washington, D.C. Source: The COVID Tracking Project, Macrobond, RBC GAM
The analysis reveals few surprises. The large states at greatest risk are Texas and Florida. Smaller states include Arizona, Idaho and South Carolina (see next chart).
Likelihood of continued spread based on lockdown severity and current transmission rates of COVID-19
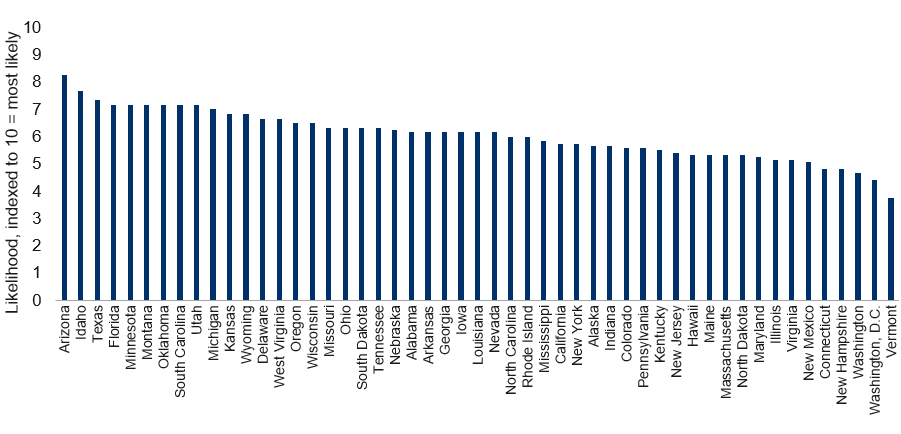
Note: As of 06/21/2020. Likelihood factors in lockdown severity and amount restrictions eased, transmission rate, and population adjusted prevalence of COVID-19. Source: Google, The COVID Tracking Project, U.S. Census Bureau, Macrobond, RBC GAM
Texas is particularly notable (see next chart), not only suffering a sharply rising number of new cases, but this is corroborated via an equally sharp increase in the number of hospitalizations and also because the positive rate from COVID-19 tests is rising.
State of Texas
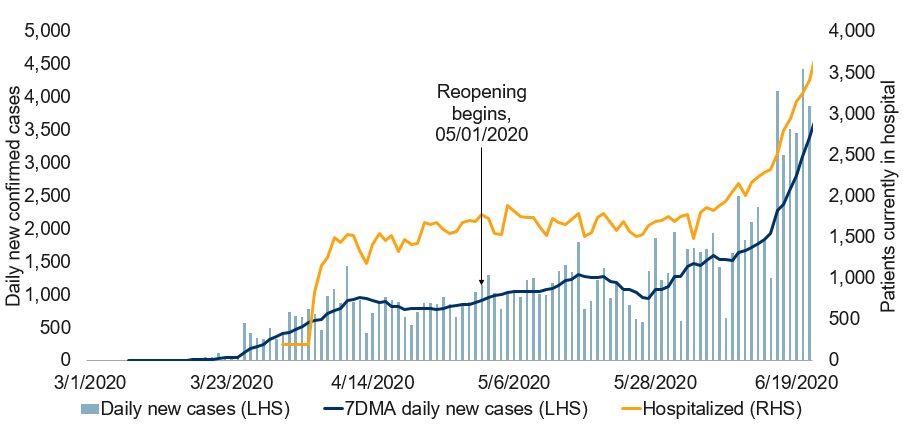
Note: As of 06/21/2020. 7-day moving average of daily new cases used as trend line. Source: The COVID Tracking Project, Macrobond, RBC GAM
Florida is suffering much the same challenges (see next chart).
State of Florida
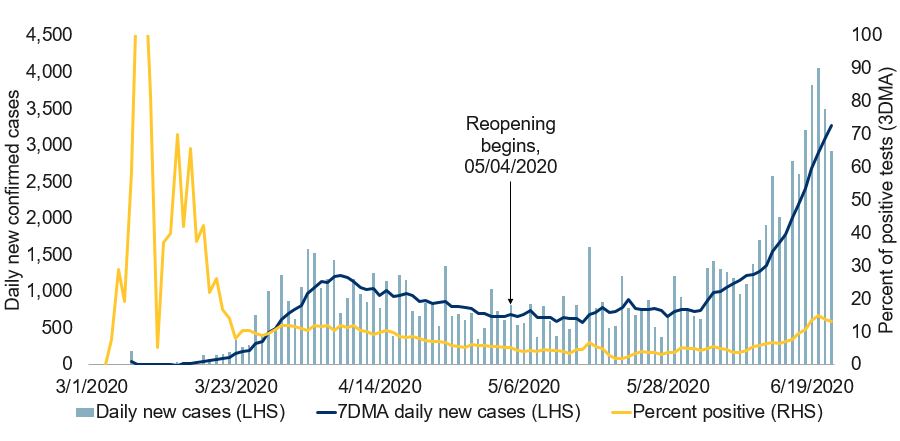
Note: As of 06/21/2020. 7-day moving average of daily new cases used as trend line. Positive rate calculated as 3-day moving average of new cases/new tests. Source: The COVID Tracking Project, Macrobond, RBC GAM
Conversely, many states (such as New York) that were previously enormously problematic in late March and early April have learned their lesson and now look extremely promising across all relevant parameters (see next chart).
State of New York
Note: As of 06/21/2020. 7-day moving average of daily new cases used as trend line. Source: The COVID Tracking Project, Macrobond, RBC GAM
How does this mess get resolved? A solution may now be brewing, though whether it is sufficiently forceful to work is an open question.
Many state governors – especially those of a Republican persuasion – are unwilling to re-impose lockdowns for political reasons. However, they may now be on to something in that some are now delegating powers to their mayors so that individual cities can opt to mandate greater social distancing measures. Such cities as Austin and Tampa have already taken the reins on social distancing for their municipalities. These jurisdictions may yet squeak through the pandemic, though many others have mayors that are much less sympathetic to the need for social distancing. In such cases, it will be up to businesses to take enhanced steps, and for individuals to show initiative.
A “no growth” world?
The arrival of COVID-19 has spurred renewed talk of aspiring toward a “no growth” world.
In the short run, the virus has undeniably halted growth, yet to many it hasn’t felt especially painful given the temporary infusion of government stimulus. More fundamentally, the pandemic has prompted many to question their system of values. It has surfaced the importance of human health over economic activity, and highlighted the importance of personal relationships and leisure, as well as the reality of extreme inequality. The COVID-19 crisis has even challenged assumptions about what might be possible from an environmental standpoint, as plane and car travel has diminished and emissions have accordingly fallen.
For all of this newfound interest, the subject is not entirely new. Ninety years ago, the great economist Keynes imagined that his grandchildren would only work 15 hours per week, opting to convert society’s rising productivity into additional leisure rather than additional wealth. This, of course, never happened.
Over the past decade, a “less growth” story has already been playing out. The normal rate of economic growth has already diminished from 3% to 2% per annum. Some countries are beginning to seek to maximize things other than GDP, such as happiness, and to better account for externalities like the environment and the importance of leisure time.
Many of these trends are likely to continue into the future. However, an outright “no growth” world is arguably not necessary.
From a human perspective, the past generation has not seen the kinds of advances in financial prosperity enjoyed by prior generations. This has proved profoundly frustrating to many, indicating that rising economic prosperity is still highly valued. Furthermore, there is evidence that those at the highest end of the income spectrum opt to work more hours than the average rather than to pursue greater leisure time as theory might suggest.
From an environmental and sustainability perspective, economic growth is not by itself a problem unless it involves additional resource usage. But a large swath of economic activity – much of the service sector, most prominently – requires very few resources and so can afford to expand with little implication for the environment or sustainability. This kind of growth is not inconsistent with the other aspirations of humankind. Already, the resource intensity of economic activity has been declining for quite some time.
To the extent policymakers attempt to redress inequality, this could well reduce the return on capital available to investors. But it could also unleash more economic growth as per a range of research arguing that high inequality is bad for growth.
It is also worth revisiting the first principles of economics. GDP growth comes from two places: more workers and more productivity.
The “more people” part is slowing for demographic reasons, but there is still some increase left to come across the remainder of the 21st century. If anything, retirement ages are edging higher, and female labour force participation rates are still tending to go up (if by much less than before). As such, the workforce can be reasonably expected to rise, barring a reduction in hours per worker.
Equally, productivity tends to go up over time. Companies are profit maximizing, and that often involves coming up with new ideas and better ways of doing things. At a minimum, it is unlikely we will all go back to VHS machines when watching movies – reverting to an inferior technology. Perhaps if capital expenditures collapsed it would be sufficient to undermine productivity via a diminished capital stock, but short of this it is hard to fathom. If regulations and taxes were sufficiently high, it is certainly possible that innovation might be substantially dimmed, but not stopped altogether.
In short, even as non-economic objectives come increasingly into focus for societies – spurred in part, but not uniquely, by COVID-19 – it seems unlikely that governments will have to sacrifice economic growth altogether. And let us not forget that many government objectives require significant government funds – best generated by a healthy economy.
U.S.-China relations
U.S.-China relations have been challenged for some time. Each country has significant complaints about the other (see next graphic). China complaints include:
- the recent U.S. imposition of tariffs and limitations on corporate champions such as Huawei
- the substantial clout of the U.S. across the Pacific
- the interference of the U.S. in Hong Kong’s affairs, and
- the extent to which the U.S. has a stranglehold on the global order.
For its part, the U.S. complains about China’s large trade surplus, its capital controls, the conduct of its state-owned enterprises and alleged intellectual property theft. The U.S. further bridles at the requirement that U.S. companies operating in China engage in joint ventures with local partners. The U.S. also objects to China’s conduct in Hong Kong and also the way that China is now challenging the global order.
Substantial U.S.-China disagreements
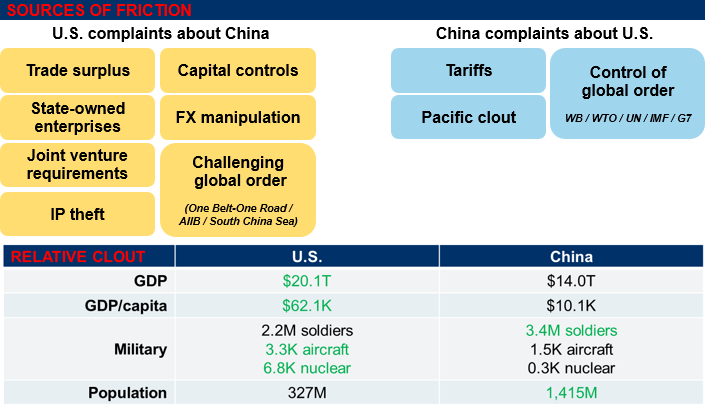
As of June 2020. Source: Haver Analytics, Wikipedia, RBC GAM
Much of this conflict was likely inevitable. There is a growing body of work studying the historical relationships between global powers. As China’s economy grew to match its population, it was arguably inevitable that the world would pivot from a hegemonic era to a multi-polar era. Classically, multi-polar eras can be difficult from an economic standpoint as multiple countries vie for control, splitting the world up into different cliques and undermining global institutions (see next chart).
Multi-polar eras are bad for global trade
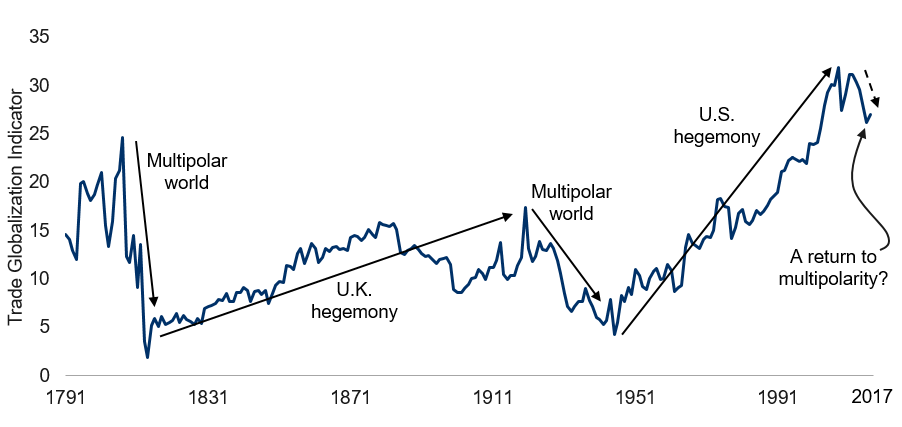
Note: Measured as average of imports as % of GDP weighted by population. 148 countries used for 1791 to 1995, 126 countries after 1995. Source: Chase-Dunn, C., Kawano, Y., Brewer, B., “Trade Globalization Since 1975: Waves of Integration in the World System,” American Sociological Review, 2000, Haver Analytics, RBC GAM
The book Destined for War by Graham Allison goes so far as to argue that new powers nearly inevitably find themselves at war with the declining power that they are replacing. This seems a hair too provocative given the deep economic linkages between the countries and the great damage such an outcome would inflict upon both parties. But it seems perfectly fair to anticipate significant friction between the nations for the foreseeable future.
The arrival of COVID-19 has further aggravated relations. In a general sense, trauma tends to cultivate isolationist attitudes. In this specific context, the U.S. blames China for the virus given its point of origin in the Chinese city of Wuhan. Chinese companies listed in the U.S. are now being put under greater scrutiny, and some are exiting the market. The U.S. and other countries are also increasingly recognizing their deep commercial dependence on China, and seeking to diversify their supply chains. With travel restricted, the divide between the two countries can only grow.
Of course, much will depend on the outcome of the U.S. election in November. A second Trump term would likely further challenge U.S.-China relations. While a Biden administration might result in moderately less friction, it would be naïve to imagine that any U.S. administration will be close friends with China. The thinking of both countries has changed profoundly over the past several years. While a Democratic administration might be less focused on tariffs, it would likely be more assertive about such matters as human rights, labour laws and the environment.
The bottom line is that China’s relationship with the U.S. will likely remain fraught for years to come. The rest of the world cannot help but be caught up in this. COVID-19 has not helped, but it is not the fundamental reason for the conflict.
Financial markets
Risk assets have staged a remarkable advance over the past few months. The S&P 500 is not much shy of its pre-COVID-19 highs despite a burgeoning second virus wave and the reality that the economic recovery will likely be gradual even in constructive scenarios.
As such, we have reduced the extent of our tactical equity overweight recommended for global, balanced investors, leaving it only modestly above our (new) neutral of 60%. It is still certainly fair to expect stocks to beat bonds and cash over the long run. And it remains entirely possible that stocks will beat the other two asset classes over shorter time horizons as well. However, equity valuations have become much less compelling over the past few months, and certain virus risks are mounting. Hence the more cautious positioning.
-With contributions from Vivien Lee and Graeme Saunders
Interested in more insights from Eric Lascelles and other RBC GAM thought leaders? Read more insights now.