Overview
The challenges have outweighed positive developments recently.
Negatives:
- There is mounting evidence of real economic damage from the Omicron wave in December and January.
- A sub-variant of the Omicron variant could be twice as contagious.
- Geopolitical risks surrounding Ukraine continue to mount.
- Inflation has increased even further.
- Central bank tightening appears to be imminent.
- Financial markets have recently tumbled.
There are fewer positives, though they are important:
- The Omicron wave may be peaking.
- Activity restrictions are beginning to ease.
- Economic activity should accordingly accelerate from there.
Omicron peaking
The Omicron wave appears to be peaking in the developed world (see next chart). This is consistent with the experience in countries that encountered the variant first – it has repeatedly proven to be a high but brief wave.
COVID-19 EM vs. DM infections

As of 1/21/2022. Calculated as the 7-day moving average of daily infections. Source: WHO, Macrobond, RBC GAM
Consistent with this, the fraction of countries reporting rising daily COVID-19 cases has plummeted from nearly 90% a month ago to just over 50% today (see next chart). This is a welcome change, though it also concedes the point that most countries have not yet encountered their peak – especially emerging-market nations. India’s infection rate is spiking again.
Countries reporting rising daily new COVID-19 cases

As of 1/21/2022. Change in cases measured as the 7-day change of 7-day moving average of daily new infections. Source: WHO, Macrobond, RBC GAM
Among the countries now mending, the U.K. infection rate is already just half its earlier peak, Canada shows some nice improvement and the U.S. numbers are down slightly. At a minimum, fewer U.S. states are suffering rising caseloads than before (see next chart).
Number of U.S. states with transmission rate above key threshold of 1

As of 1/23/2022. Transmission rate calculated as 7-day change of underlying 5-day moving average of new daily cases, smoothed with 7-day moving average. Transmission rate above 1 suggests increasing new daily cases. Includes Washington, D.C. Source: Haver Analytics, Macrobond, RBC GAM
Cross-checking the numbers
Given insufficient tests, infection numbers must be taken with a grain of salt. Fortunately, test positivity data is also available – a proxy for under-testing – and this, too, is beginning to improve. Not only is Canada’s official infection count down, but the country’s test positivity rate has also fallen from 40% to under 20% (see next chart). The U.S. has not yet managed a similar turn.
COVID-19 cases and positivity rates in Canada

As of 1/21/2022. 7-day moving average of daily new cases and test positivity rates. Source: Our World in Data, WHO, Macrobond, RBC GAM
Finally, hospitalization rates – another good proxy for the state of the pandemic at a time when infection counts are suspect – are beginning to decline in some countries (see next chart). These include South Africa, the United Kingdom and Israel. Hospitalizations move with a lag to infections, hence the exclusivity of the group.
COVID-19 hospitalizations in developed countries

Based on latest data available as of 1/22/2022. Source: Our World in Data, Macrobond, RBC GAM
What are the true infection numbers?
The Lancet – among the most well-respected journals covering COVID-19 – published an estimate from the Institute for Health Metrics and Evaluation that global daily infections are now a remarkable 30 times higher than in late November – far more than the 6-fold increase suggested in the official figures. In other words, under-testing and asymptomatic cases are rampant.
Further, the institute estimates that half of the world will contract COVID-19 between the end of November 2021 and the end of March 2022. If the wave in their model is symmetrical, that would mean that a quarter of the world has already contracted COVID-19 through mid-January!
The clear negative of so many infections is the sheer number of sick people, with a subset suffering bad outcomes. The clear positive is that a large fraction of the world will achieve strong antibody and T-cell protection against future infections.
Another variant
In the “don’t assume it’s the last wave” department, since mid-December there have been reports of an Omicron sub-variant named BA.2. It can be found in 40 countries, including India and many western European nations.
Sub-variants crop up all the time, but BA.2 is worrying because it appears to be significantly outcompeting the original Omicron strain in Denmark (to the point of now representing over 50% of new infections), with a sharply rising trend now reported in the U.K., Germany and the Netherlands. Over half of Indian infections may also be of the BA.2 variety.
Estimates from Denmark are that BA.2 possesses a 90% growth advantage versus Omicron. The early estimate in the U.K. is that it has a whopping 120% growth advantage. This means that it can be expected to spread around twice as quickly as Omicron. That’s pretty remarkable and frankly distressing given that Omicron was already among the most contagious viruses in history. That said, the data isn’t yet very good, in part because standard tests cannot distinguish between BA.2 and the Delta variant.
It is too soon to say whether BA.2 is more contagious or instead better at bypassing vaccines. The distinction does matter to the extent it informs the extent to which vaccinated people should be concerned and whether vaccine-makers need to revise their formulas, but in the short run it is all the same: there would seem to be the looming risk of another wave.
The BA.2 hospitalization rate appears to be about the same as for Omicron, so the additional transmissibility is not obviously paired with reduced severity.
Omicron severity
Adding to mounting evidence from the past month, new research confirms that Omicron infections are only moderately less severe than versus the Delta variant. The sharp drop in realized hospitalizations and deaths has more to do with a higher level of vaccination and antibodies than the specific parameters of the disease.
Most recently, a preprint study from South Africa argues that Omicron is just 25% less likely to cause hospitalization or death relative to the Delta variant.
In practice, it is still excellent news that there have been fewer bad outcomes with the Omicron wave whether thanks to its innate characteristics or prior immunity, such that a California study finds 52% fewer hospitalizations per infection, 74% fewer intensive care unit admissions and 91% fewer deaths relative to prior waves.
Lockdowns ebb
Notwithstanding the possibility of another COVID-19 wave, there is evidence that we are passing peak lockdown. This is mostly in the form of government announcements that restrictions are being or will soon be eased.
While our lockdown severity index shows a significant rebound, it should be conceded that much of this represents the end of holiday distortions rather than true behavioural changes (see next chart). Further genuine easing should become visible in the coming weeks.
Severity of lockdown varies by country

Based on latest data available as of 1/17/2022. Deviation from baseline, normalized to U.S. and smoothed with a 7-day moving average. Source: Google, University of Oxford, Macrobond, RBC GAM
There are two reasons governments are easing their rules. First, the Omicron wave appears to be peaking or even receding in many jurisdictions.
Second, attitudes toward COVID-19 continue to evolve. In early 2020, most countries were in a zero-tolerance mode. They then progressed toward a limited-tolerance approach over the past year and a half. Now, as the willingness to abide by restrictions erodes, vaccination campaigns approach saturation and the rate of bad outcomes diminishes, countries are increasingly choosing to view COVID-19 as akin to a flu: something that weighs on hospitals but doesn’t justify altering daily life.
Even as restrictions ease, the global economic hit from the Omicron wave remains significant: according to Goldman Sachs estimates, the current level of restrictions are consistent with economic activity that is around 1.5% lower than before the wave, and around 3.5% lower than it would have been in the absence of the pandemic altogether.
Of course, somewhat uniquely to this wave, a significant fraction of the economic damage has come from the number of people out sick from work. To the extent that hospitalizations have not yet peaked in most jurisdictions, neither has this effect. Some companies are reporting that as much as 30% of their workforce is absent from work due to illness.
China has marched to a different drummer for much of the pandemic. It recently lifted restrictions on the city of Xian, but began conducting aggressive testing in Beijing – possibly a sign of problems brewing in the capital just as the Olympics prepare to alight.
Glum markets
Risk assets such as stocks have performed quite poorly in recent days and weeks. At the time of writing, the S&P 500 is down around 10% from its peak – in the realm of a correction.
The stock market decline is not completely indiscriminate. Higher beta stocks are naturally down by more, though that is normal. More interestingly, it is the most expensive and lowest quality stocks that had previously led the market that are now underperforming. The tech sector figures largely in this.
Why are markets retreating? It arguably has little to do with COVID-19 given that Omicron is actually beginning to improve. We think the main reason is that the U.S. Federal Reserve is gearing up to begin a tightening cycle. This has created anxiety over the prospect of more restrictive policy in general, and then all the more so as central banks have pulled forward and ratcheted upwards their planned tightening.
And, of course, beneath central bank tightening lies high inflation. While we don’t believe inflation will be structurally elevated, if one wanted to reprice the stock market for a persistently 4% inflation world rather than a 2% world, you could argue fair value in the stock market should decline by about 10%. We hasten to emphasize again that we do not believe there is a structural change in inflation underway.
High uncertainty
Perhaps also explaining financial market jitteriness, there is a considerable amount of uncertainty about the future. Expected stock market, bond market and currency market volatility have all increased significantly (see next chart). That said, the new levels are hardly at historic highs – they are instead in the realm of levels reached perhaps once per year.
Volatility creeping higher

As of the week ending Jan 21, 2022. Jan 2007 = 100. Source: Bloomberg, RBC GAM. Shaded area represents recession.
The term premium in the bond market can also be a proxy for uncertainty. It has also increased lately, though it is hardly high (see next chart).
Term premium has been rising since the start of 2022

As of 1/20/2022. Source: Federal Reserve Bank of New York, Haver Analytics, RBC GAM
Finally, we can look directly at a measure of monetary policy uncertainty, which confirms a sharp increase, though it is merely the sort of uncertainty that one encounters every year or so (see next chart). Come to think of it, that could also describe the frequency of the sort of financial market indigestion currently on display.
U.S. monetary policy uncertainty jumps as inflation rises sharply

As of Dec 2021. Index normalized to a mean of 100 from 1985 to 2010. Shaded area represents recession. Source: www.policyuncertainty.com, Macrobond, RBC GAM
Economic trough
It is increasingly clear that economic activity did slow in December and January in response to the Omicron variant.
Traditional data
The U.S. Markit flash PMI for January reveal a service index that fell fairly sharply, to just 50.9. Meanwhile, December retail sales shrank by 1.9% and December industrial production compressed by 0.1%. The Atlanta Fed’s fourth-quarter GDP tracker recently retreated from +7% to a (still good) +5%.
Meanwhile, Europe’s composite flash PMI for January fell to its lowest level in 11 months, with a particular hit to the service sector. German GDP for the final quarter of 2021 is also tracking a slight decline, consistent with an Omicron hit to the final month of the quarter, and also a Delta variant blow early in the quarter.
Real-time data
Real-time economic data also highlights Omicron-induced weakness in high-touch sectors. U.S. hotel occupancy has fallen sharply in recent months (see next chart).
U.S. hotel occupancy has been falling since summer

For the week ending 1/15/2022. Source: STR, Wall Street Journal, RBC GAM
Restaurant reservations are in retreat globally (see next chart).
Restaurant reservations

As of 1/19/2022. 7DMA of % changes vs. 2019. Seated diners from online and phone reservations and walk-ins, based on a sample of restaurants on Open Table. Source: Open Table, RBC GAM
And real-time consumer spending measures have been softening – slightly in the U.S. and more notably in Canada (see RBC’s card-based data in the next chart).
Omicron fears caused shoppers to retreat over the holidays
% change from 2019 (pre-shock) levels, 7-day rolling average
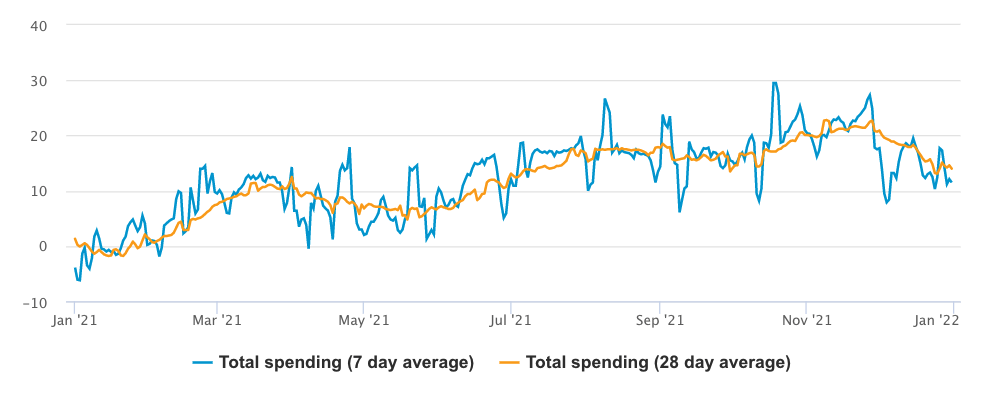
Report dated 1/11/2022. Source: RBC Economics, RBC Data & Analytics
Canada’s business conditions index also shows some pain from the latest COVID-19 wave (see next chart).
Business conditions in Canada deteriorated during Omicron wave

As of 1/3/2022. Equal-weighted average of Business Conditions Index of Calgary, Edmonton, Montreal, Ottawa-Gatineau, Toronto, Vancouver and Winnipeg. Source: Statistics Canada, RBC GAM
More generally, U.S. jobless claims rose substantially in the latest week, to their highest (worst) reading since mid-October. Some Omicron pain has evidently invaded the labour market, too.
Canadian Business Outlook Survey
For all of the weakness in December-January data, the outlook is still fairly good for 2022. Fresh evidence for this comes from Canada’s quarterly Business Outlook Survey. It shows strong future sales expectations, plus the greatest plans to invest in capital expenditures and to hire workers over the coming year in decades. This is in line with U.S. surveys that continue to also show strong cap ex and hiring plans.
Meanwhile, the capacity-based questions point to extreme economic tightness. Labour shortages are getting worse, a record number of businesses expect upward wage pressures, and the majority of respondents expect inflation of over 3% – also a record.
Personal savings
It is notable that the era of high U.S. household savings is now over (see next chart). The savings rate has retreated from record pandemic highs. High savings rates had been a function of limited opportunities to spend and generous government benefits. There is nothing wrong with the new level, and households still possess the extra money they socked away over the past two years. Nevertheless, it means that the easy spending gains – from incrementally saving less – have already been banked. The consumer spending outlook from here is now good rather than great.
U.S. personal savings rate returns to pre-pandemic levels

As of Nov 2021. Shaded area represents recession. Source: BEA, Macrobond, RBC GAM
Interestingly, Canadian households continue to save more than normal, albeit less than during peak pandemic (see next chart). This persistent additional saving is likely in part because the country operates under greater restrictions that limit spending, and in part because Canadian government pandemic support remains more generous than in the U.S. Thus, some spending upside remains in Canada, though any enthusiasm must be tempered against the fact that some of the savings will naturally vanish as government supports ebb, and because Canadian households have worse indebtedness than households in the U.S.
Canadian household savings rate has dropped but remains high

As of Q3 2021. Source: Macrobond, RBC GAM
Inflation
Inflation remains extremely high, with recent CPI readings in Canada, the U.K. and the U.S. achieving +4.8% year-over-year (YoY), +5.4% YoY and +7.0% YoY, respectively. The rate of inflation should remain quite hot through January given the recent increase in oil prices. Still, over the span of the next several months, we expect to see some peaking and then improvement.
Supply chain constraints are set to become less extreme, especially once Chinese New Year (February 1) and the Omicron surge abate. This has been a source of considerable inflation.
Oil prices should also become less high. That clearly hasn’t been the trend in recent months given mounting geopolitical concerns, but credible forecasters such as the International Energy Agency continue to anticipate oil supply exceeding oil demand across 2022. Indeed, it appears that U.S. shale oil producers have recently awoken from their slumber, and should contribute significantly to that supply going forward (see next chart).
U.S. crude oil field production (barrels/day)

As of 1/14/2022. Source: EIA, Haver Analytics, RBC GAM
Somewhat unexpectedly, U.S. dwelling cost inflation has also settled back down. Apartment List estimates that the monthly change in U.S. rent turned negative in December for the first time in over a year, after rising by 1—3% per month for much of 2021. We are not convinced that dwelling cost deflation is imminent, but the largest blast of dwelling cost inflation may be over.
The bad news (at least from a purely inflation perspective!) is that companies continue to indicate they expect to increase worker compensation to an extent not seen in decades, with the cost of labour already cited as the single most important problem by the National Federation of Independent Businesses. Some of this will bleed into inflation given that businesses have also indicated they plan to pass cost increases through to their customers. Fortunately, wage growth is not quite as extreme as commonly imagined, with even low-skill wages rising only a little more quickly than the economy-wide median (see next chart).
Wage growth of low-skilled workers outpaces other groups

As of Dec 2021. 12-month moving average of median wage growth. Source: Federal Reserve Bank of Atlanta, Haver Analytics, RBC GAM
One interesting possibility is that while low-skill workers are demanding higher wages, high-skill (office) workers may instead ask for non-pecuniary benefits such as the capacity to continue working from home. That doesn’t obviously add to inflation or cost companies money – in fact, it may save them money over the long haul.
Although there have been a few instances of high profile strikes over the past year, the reality is that workers have not (yet) been more inclined to strike despite their strong bargaining position and the large increase in their cost of living (see next chart). This metric merits continued watching to see if workers become more emboldened later.
Person-days not worked from work stoppages

Canadian work stoppage data includes those with 10 or more person-days not worked. U.S. work stoppage data includes work stoppages involving 1,000 or more workers. Source: StatsCan, U.S. BLS
Central banks
Bond yields have risen sharply in recent weeks as markets price in the beginning of central bank tightening. A key date point now approaches: both the U.S. Federal Reserve and the Bank of Canada meet on January 26.
In the U.S., financial markets now price in a fourth rate hike for this year, representing a move at every second meeting across 2022. The imminent Fed meeting on January 26 should yield some signaling about a March rate hike, alongside additional guidance on the completion of quantitative easing by March. There should also be some discussion of the quantitative tightening that comes later. We are beginning to pencil in assumptions to this effect, with an annualized pace of around $1 trillion per year in sales – the equivalent of around an extra 25bps rate hike per year.
For Canada, the market now prices in nearly 8 rate hikes for 2022 – a remarkable number. That is essentially a 25bps rate hike at every Bank of Canada meeting across the year. It is hard to justify why Canada should tighten twice as much as the U.S. over the coming year – we tend to think it may be less.
The Canadian tightening cycle could start as soon as this week: markets have priced 63% of a rate hike for January 26 itself. While it would be no huge loss if the Bank of Canada delayed that first hike until March, there are several reasons why a sooner hike would be justified: financial markets are already mostly there, economic conditions would appear to justify it, there isn’t much obvious advantage to waiting, the CD Howe Institute’s shadow monetary policy council voted in favour of tightening, and this meeting is accompanied by a Monetary Policy Report to explain the central bank’s thinking. Perhaps the main knock against an imminent hike is that the country still has a sliver of economic slack left – though this is arguably trumped by how high inflation has become.
Monetary tightening is not inherently bad if it is justified, which this prospective tightening cycle appears to be. It can even be argued this is a positive development to the extent it may help to lengthen the economy cycle if the risk of overheating is reduced.
Still, market trepidation is understandable, for four reasons:
- First, it has been a while since most of these central banks last tightened – this all feels unfamiliar. Those who do remember prior episodes recall that the last major tightening cycle encountered a few taper tantrums.
- Second, aggressive monetary tightening tends to be viewed less favorably by the economy and financial markets than does a gradual pace – and there is a sense of urgency in current plans.
- Third, markets might be more forgiving if the rate hiking was to deal with excessive economic growth. But it is instead mainly to deal with excessive inflation – a less benign interpretation.
- Fourth, while the imminent tightening probably isn’t a policy error, it has come to light that central banks were arguably making a policy error over the past six months by not responding to high inflation then. Even though the imminent tightening helps to fix that problem, it is disconcerting that a policy error has nevertheless been revealed to have occurred.
Fortunately, past taper tantrums were short-lived – the most likely fate for this one.
Mathematically, four theoretical rate hikes and some quantitative tightening from the Fed over the coming year should subtract something like 0.6 percentage points from U.S. GDP growth for the year. For Canada, 8 rate hikes (of which we are dubious) plus quantitative tightening would subtract something like 1.2 percentage points from Canadian GDP growth for the year. While significant, this is not exactly the stuff of recessions when the market consensus is in the realm of 4% growth for both countries in 2022 (and given that some tightening was already priced into those forecasts).
Rate hike elasticity
Over the past decade, we have generally operated with the view that economies are more sensitive to rate hikes than in the past. This is because there is more public debt than before, increasing the burden of debt servicing to a greater extent.
However, particularly in the U.S., household debt-to-income has been handily reduced over the course of the pandemic. It is the government debt-to-GDP ratio that has increased. To the extent that government spending is not especially sensitive to interest rates in the short run, that actually yields the conclusion that the overall U.S. economy may have become somewhat less sensitive to interest rate changes over the past few years. This could imply some resilience even as rates rise.
Ukraine
Ukraine and Russia are again in focus as Russia amasses weaponry along the Ukrainian border. The two are not strangers to conflict: Russia invaded and captured the Crimean portion of Ukraine in 2014, and has maintained an outsized influence over parts of eastern Ukraine ever since.
The rate of troop movement and seasonal considerations argue that Russia is likely to act soon if it ultimately opts to invade. Some diplomats and the families of diplomats are now leaving Kiev.
Russia says it is threatened by NATO as that organization looks to welcome Ukraine, and in so doing expand right to Russia’s border. Russia demands that former Soviet bloc countries never be allowed to join, that NATO remove its weaponry from eastern European nations, and that the U.S. remove all nuclear weapons from Europe.
NATO members are unlikely to oblige these requests. The U.S. and others have been vocal in warning Russia not to take further actions, and are much better prepared than they were in 2014. Some military repositioning has occurred, and the U.S. has threatened a forceful response.
The Good Judgement crowd forecast assigns a 75% chance of a Russian invasion resulting in fatalities. Thus, it is not certain, but it is deemed likely. We are inclined to assign a somewhat lower probability, but no lower than 50%. Of course, such an invasion could take any number of forms. A mild invasion scenario would find Russia crystallizing control over the 7% of Ukrainian territory with a significant Russian population that it has already functionally possessed via rebels for the past seven years. A more aggressive invasion would see Russia claiming a large portion of the country. An extreme scenario would see the capital claimed and the government forcibly overturned. The worst-case scenario would be the above plus direct military conflict between Russia and NATO nations, as opposed to merely with the Ukrainian military.
That said, there are certainly ways in which a military conflict can be avoided. Russian President Putin becomes more popular domestically when he threatens war on others. So long as he can extricate himself without appearing to have lost, he will enjoy higher popularity. Russia could also “win” if the stress put on Ukraine results in the fall of its government, with the possibility of more Russian influence thereafter (though it is hard to fathom voters inclining in this direction after recent threats). This episode could also decrease Ukraine’s inclination to join NATO, and reduce the likelihood of other border states later joining NATO – a win for Russia.
Alternately, military conflict may be avoided – or quickly halted – via aggressive sanctions on Russia. This could include limiting the travel and financial flows of senior government officials or blocking Russia from accessing the global SWIFT financial network (which would be economically catastrophic for Russia in the short run but could backfire against the U.S. in the long run if a competing network were developed). It could also mean preventing Russia from accessing key electronic components. The Russian stock market has retreated on these fears.
Of course, Russia has a trump card of its own. It provides for a large fraction of Europe’s energy needs, famously via natural gas pipelines, but also in the form of oil and coal. If Russia were to turn off the spigot, that would be a big problem for Europe. Of course, it would also be a huge problem for Russia from a government revenue perspective. Furthermore, it might trigger the aforementioned sanctions, motivate reluctant countries such as Germany to participate more fully in any military opposition to Russia, and ultimately encourage Europe to turn away from Russian energy via a mix of alternative sources in the medium run and renewable energy in the long run. As such, we think any energy shutoff is unlikely barring a worst-case confrontation.
What to take from all of this? The Ukrainian situation is an undeniable geopolitical risk, and one of particular significance to energy prices. That said, a major military conflict is not a part of our base-case economic forecast. Major geopolitical risks rarely manifest, and even when they do, they rarely have a lasting influence on the economy or global financial markets. The events of seven years ago certainly didn’t.
-With contributions from Vivien Lee and Aaron Ma
Interested in more insights from Eric Lascelles and other RBC GAM thought leaders? Read more insights now.