I spent several enjoyable days last week visiting clients and contacts in Ottawa and Montreal. Miscellaneous revelations included the following:
- Bizarrely, it is impossible to travel from Ottawa to Montreal after 7pm by either plane or train.
- The two cities now constitute Canada’s hottest housing markets, quite a contrast to their sluggish performance across most of the prior decade.
- Alas, Montreal’s road construction and resultant traffic fully warrant the (anti-)hype.
- Serendipitously, the salad bar of a Kanata “Farm Boy” grocery store was found to contain all of the ingredients necessary to fashion a truly spectacular steak salad – it was undoubtedly the meal of the trip!
With a full belly, let us venture on to more pressing topics…
Global Investment Outlook:
- Our flagship quarterly publication is available, with a lead article entitled “ Slowing growth, mounting risks”.
Repo surge:
- The U.S. overnight repo rate surged briefly to a sky-high 10% last week before returning to normal with the assistance of U.S. Federal Reserve intervention.
- Repo rates reflect the amount charged when one bank borrows from another using safe securities as collateral. The borrowing cost is normally just slightly above the fed funds rate.
- The recent spike captured attention and raised eyebrows in part because the last spike occurred in 2007 in the lead-up to the global financial crisis.
- Might this latest episode reflect burgeoning financial sector stress, possibly serving as a precursor to crisis or recession?
- Probably not.
- Most importantly, there is little sign of financial distress in other financial sector measures. Credit default swaps do not suggest that banks are becoming more dangerous, nor do 3-month LIBOR spreads (London Inter-bank Offered Rate). The latter, it should be acknowledged, has roughly doubled from 18bps to 34bps, perhaps reflecting a variety of late-cycle developments. But the new level is still lower than it was on two separate occasions in 2018.
- Furthermore, the reason repo rates blew wider during the financial crisis was not merely that U.S. banks were stretched, but also because the collateral used for repo transactions was often mortgage debt, which was itself beginning to implode. In contrast, repo loans today mostly use government bonds.
- Where, then, did the temporary repo market distress come from? It was arguably a function of four things:
- U.S. corporations had to make their quarterly tax payments, resulting in the sudden withdrawal from banks of a large sum of money in a short period of time. This left banks with insufficient cash, pushing more of them than usual to attempt to borrow from the repo market, and fewer than usual to lend into it – a classic recipe for a higher borrowing rate.
- A large $77 billion in T-Bills was issued recently by the U.S. government. Banks bought a large fraction of the sum, as usual. Payment came due on September 16, creating a liquidity pinch.
- As a broader observation, banks are trying to hold structurally more cash than in the past – one of many lessons learned from the global financial crisis. Thus, the willingness to lend into the repo market is limited, particularly at a time when any extra funds can instead earn interest at the Fed as excess reserves.
- Lastly, the Fed has shrunk its balance sheet considerably over the past year as it has unwound quantitative easing, with banks’ excess reserve holdings declining in step with this from $2.2 trillion to $1.4 trillion. Some now believe that this is too little cash for banks.
- As a quick fix for these problems, the Fed intervened in the market, injecting up to $75 billion per day into the short-term money market in an effort to balance out supply and demand. It was largely successful in this regard, with the overnight repo rate returning to a normal level. The Fed will furthermore offer term repo operations over the next few weeks to keep the market flowing smoothly.
- Beyond that, the Fed is thought likely to make several tweaks to ensure such an event does not recur at a later date. These may include lowering the interest rate on excess reserves such that banks will be more incented to lend into the repo market, and possibly opting to expand the size of the central bank’s balance sheet in an effort to ensure sufficient cash is available to banks.
- This last possibility seems potentially quite consequential, as it would mean the return of quantitative easing at an earlier juncture than previously imagined. Presumably any such action will be small in scale and perhaps even offset by slightly less easing via other mechanisms such as rate cutting, but it is nevertheless worth highlighting.
- For the moment, the only immediate economic effect of the temporary repo rate shock is that financial institutions found it more expensive than usual to conduct business for a handful of days. To the extent we don’t expect it to persistently rear its head again, there is unlikely to be a palpable effect on the broader economy.
Postive surprises
- Continuing what has been an indisputably schizophrenic approach to the identification of economic trends –swiveling our focus back and forth between positive and negative developments from week to week – this time we acknowledge a raft of recent positives.
- We must start, of course, with the observation that markets have themselves been fairly happy. We already wrote about the increase in bond yields in last week’s note, but the stock market has also advanced.
- Perhaps helping to explain the enthusiasm of risk assets, economic surprises have increased nicely (see chart below), now operating in positive territory at the G10 level, and also for each of the U.S., Canada, U.K. and Japan. China hovers just below neutral, while the Eurozone is moderately negative (though less so than before).
Global economic surprises abound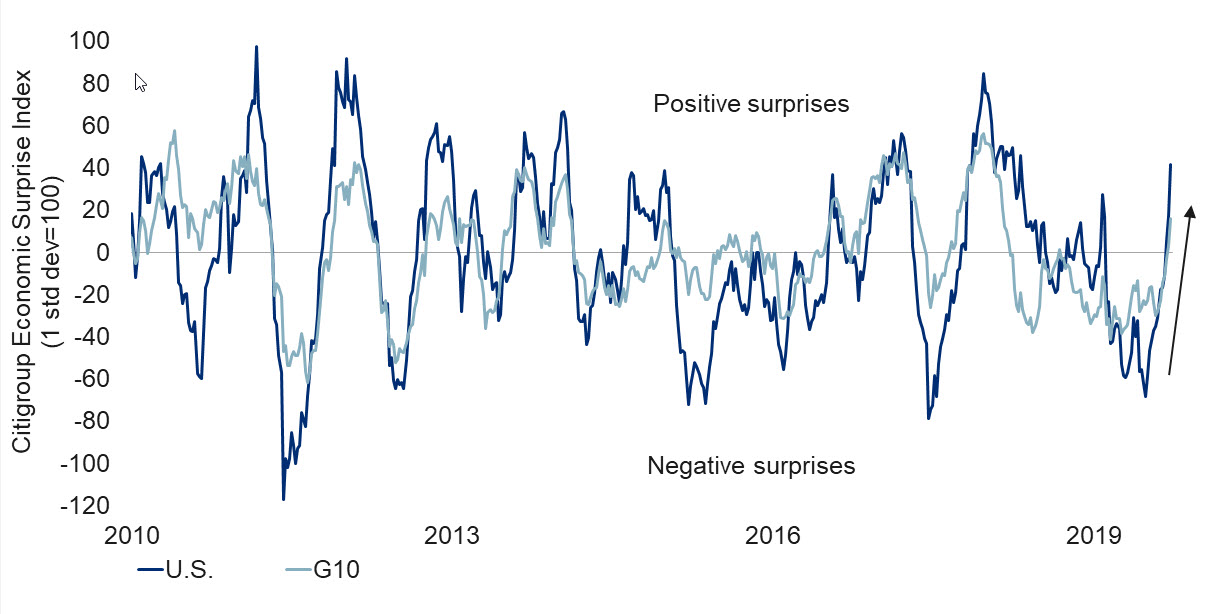
Note: As of 9/20/2019. Source: Citigroup, Bloomberg, RBC GAM - Positive economic surprises are important. Markets endeavor to price in all knowable information. By definition, a positive surprise represents something that wasn’t previously known and will thus deviate markets higher, much as a negative surprise will send them lower.
- That said, positive economic surprises should not be confused with outright improving economic data. Most of the recent improvement in surprises represents reduced expectations rather than actively strengthening data (see next chart).
U.S. Data Change Index deep in negative territory
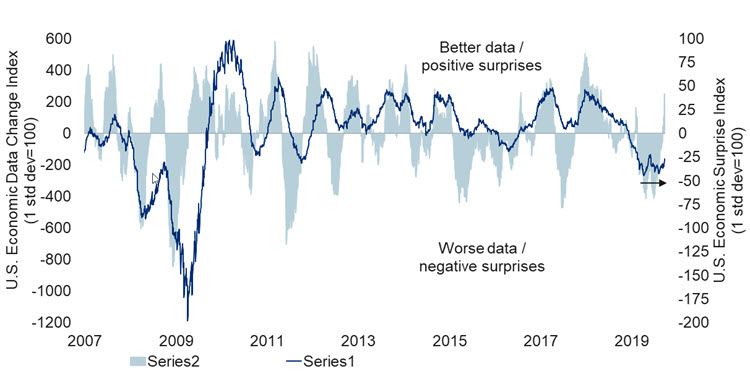
Note: As of 9/20/2019. Surprises = Data Change - Consensus Change. Source: Citigroup, Bloomberg, RBC GAM - While U.S. hard data may not be actively improving, as per the aforementioned chart, what about forward-looking metrics like purchasing manager indices (PMIs)? These also show some improvement, though with an asterisk.
- The JP Morgan Global Manufacturing PMI rose slightly in August, interrupting what has been a rarely broken downward trend dating back to the start of 2018. Developed regions that recorded increases in August include Australia, the Eurozone, Norway, Sweden and Switzerland. Emerging economies that rose include China, Brazil, South Korea, Poland and Turkey.
- However, the asterisk that accompanies this observation contains three partial counterpoints:
- The global metric barely increased – it was more of a steadying after a long decline.
- An alternate specification of the measure that uses the popular ISM Manufacturing Index for the U.S., rather than the less popular Markit U.S. Manufacturing PMI, continues to show a slight decline for the global metric in August.
- A few tentative September prints have been released and the Eurozone in particular has suffered a pronounced fall that suggests August may not represent the true bottom that many were hoping for.
- We are also happy to report that our high-frequency version of the NY Fed’s recession probability indicator has fallen from a high of 43% in early September to “just” 35% today. This is the direct result of higher yields and the partial re-steepening of the yield curve in recent weeks. Of course, a 35% risk is still materially higher than normal and continues to weigh on expected market returns over the coming year. Furthermore, while a re-steepening yield curve does simplistically reduce the recession risk, it doesn’t press the “reset button” in the sense that many economic variables continue to suggest a vulnerability to overheating.
China data trend
- China demonstrates weakness in most of its real activity metrics:
- Reflecting protectionism and slowing global growth, Chinese exports have fallen 1% year-over-year (YoY) and imports are down 6% YoY.
- Chinese industrial production growth is now up just 4.4% YoY, a profoundly slowing trend and strikingly weak when one considers that it is a nominal rather than a real figure.
- Chinese retail sales growth remains better than that of industrial production, but it is also undershooting expectations with just 7.5% YoY nominal growth. Furthermore, China’s motor vehicle sales are down outright over the past year.
- Thus, the Chinese economy is clearly on a slowing trend, and a mounting number of forecasters have felt bold enough to forecast sub-6% growth for Chinese GDP in 2020 – below the lower bound of the country’s formal growth target.
- The Chinese government’s stimulus efforts are visible in places:
- Our Chinese credit impulse metric shows its first increase in several years as China pivots from deleveraging to tentative re-leveraging. Reflecting this, China’s latest total social financing print arrived above expectations.
- When Chinese investment activity is disaggregated into private- versus government-sourced components, the government cap ex growth has been on an upward trajectory for more than a year, while the private-funded cap ex is outright shrinking (see next chart).
Chinese private vs public fixed investment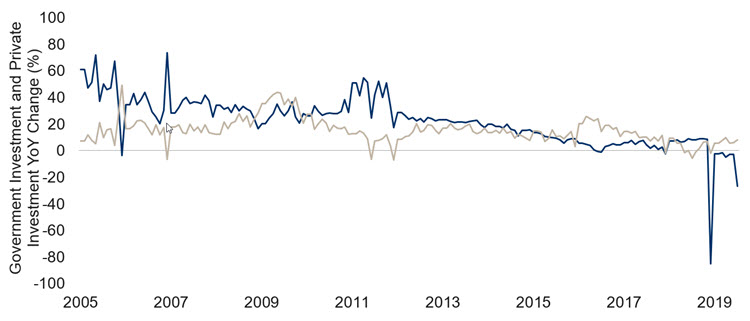
Note: As of July 2019. Source: Macrobond, RBC GAM
Japanification of Europe
- The Japanese economy has suffered through several decades of poor demographics, low inflation, slow growth, a large current account surplus, high public debt and (increasingly) ultra-low interest rates.
- Among other major developed regions, the Eurozone bears the greatest resemblance to Japan. For instance, the Eurozone has increasingly acquired the very same demographic qualities that appear to have set Japan on its troubled path. Consequently, the region has also tentatively tipped in Japan’s direction when it comes to low inflation, slow growth, a current account surplus and remarkably low interest rates. The term “Japanification” is being increasingly used to describe Europe.
- Just how apt and worrying is this descriptor?
- We identify three reasons why Europe should avoid succumbing to the full extent of Japanification:
- First, Eurozone demographics will not be as bad over the coming two decades as Japan’s were over the past two decades. The Eurozone enjoys some immigration and a slightly higher fertility rate. Thus, while not good, the foundational problem is not as severe for the Eurozone.
- Japan’s problems are at least in part a result of its initial poor policy response. Japan was late and hesitant in its delivery of monetary stimulus after the country’s early 1990s crash. It allowed banks and many corporations to linger indefinitely as zombies rather than cull the herd. The Eurozone has not been perfect in these regards, particularly when compared to the U.S., but it has nevertheless made some difficult decisions over the past decade and should thereby avoid the extremity of the Japanese situation. Europe’s corporate governance is also arguably superior to that of Japan.
- Let us recognize that even Japan is now managing a partial escape from Japanification. On the back of Prime Minister Abe’s three-pronged Abenomics, Japan has arguably managed to claw its rate of sustainable GDP growth up from perhaps 0.5% to 0.75% per year (a 50% increase) and it is no longer seemingly stuck in perpetual deflation (though 2% inflation still proves elusive). If Japan can achieve these small improvements under a more adverse set of circumstances, the Eurozone can probably fend off the full effect.
- Of course, in one important way, Europe is actually more hamstrung than is Japan:
- Europe arguably has a coordination problem in that 28 countries share command of the European Union and 19 countries share a single currency. Arriving at bold, nimble and potentially unpopular policy decisions is much harder in this political construct than within a single homogenous country like Japan.
- As an extension of the above point, Europe’s political structure has resulted in the imposition of strict fiscal rules that limit the region’s ability to stimulate its way out of deflationary thinking or economic trouble. In contrast, Japan has had no such limitation. While one can (not unreasonably) fret about the enormity of Japan’s public debt-to-GDP ratio, the country has so far benefited from additional fiscal largesse that has proven to be effectively free given the very low interest rates.
- In conclusion, Europe does bear considerable similarities to Japan. Recent developments in its growth, inflation and interest rates argue the region is at least suffering from a mild case of Japanification. However, the disease is unlikely to become as dominant as it has been for Japan, in part because Europe’s underpinnings are not as poor, and in part because Japan itself is showing some (limited) ability to treat its own symptoms.
- For a moment, the European Central Bank’s (ECB’s) pledge to conduct unlimited quantitative easing until inflation normalized near 2% had succeeded in raising the continent’s 5yr-5yr inflation expectation, but the measure has since returned to its prior level. More proof and/or effort is apparently needed to get the inflation part of the story back on track.
- It is worth reflecting on the fact that the average person in Japan wouldn’t necessarily feel they had been stuck in a 20-year purgatory. The country’s unemployment rate is low, government support is substantial and living standards are at a First World level. It is the country’s financial markets and corporate sector that have lagged beyond the world.
- Looking further out, the great fear is that the U.S. and Canada (and perhaps even China, given its own hideous demographics) will themselves eventually succumb to Japanification. They already show some slight symptoms. Fortunately, the U.S. and Canada enjoy better demographics than Europe, and China still manages to churn out sufficient productivity growth to offset its own population challenges.
- Europe will prove the test case. One imagines the ECB will be laser-focused on normalizing inflation. Whether the fiscal wing of European governments will manage to deliver the kind of structural reforms that can boost growth is a much less certain question.
Brief notes
- Saudi oil production has rebounded as much as 75% of the way back to normal after the Iranian attack last week, according to Reuters. Oil prices have accordingly slid away from their highs. The situation is still far from normalized from an oil production perspective, however. Furthermore, the vulnerability of the Middle East’s oil infrastructure is now apparent. But the U.S. seems steadfast in its preference not to respond with force, and Iran subsequently made a gesture of goodwill by releasing a U.K. oil tanker from its control.
- The U.S. Federal Reserve policy decision on September 18 revealed the expected 25bps rate cut, though with a hawkish twist in that the dot plots showed that the majority of Fed participants do not anticipate any more easing this year, with a sizeable minority actually preferring to return to monetary tightening. Rate hikes seem quite unlikely to our eye, and we still flag the possibility of another cut this year. Much will be determined by event risks relating to such matters as trade negotiations and Brexit that could be clearer by the end of October.
- Even as the Fed suggests little further stimulus to come, the Bank of Japan and Bank of England, in their own recent meetings, each hinted at a willingness to pivot toward monetary stimulus in the coming months.