As the air grows crisp and the leaves begin to turn, my mind invariably returns to the autumn cross-country races of my youth. Running was my sporting passion. The years went by with a metronome-like regularity: nearly without fail, I would win the various Ottawa-based races before flaming out in truly spectacular fashion at the Ontario school championships. I once managed partial redemption by winning the Ontario club title, but that was indisputably the lesser of the two provincial mantles.
In recent years, my own children have taken up running and have enjoyed more than their share of success. But what feels most familiar isn’t so much the rough terrain or the ragged breathing at the crest of a hill as the bittersweet emotions the sport elicits. There is little joy greater than besting a field of hundreds, nor crushing disappointment worse than badly underperforming after so much grueling preparation. It is not a sport for the fainthearted.
Financial markets are also not for the fainthearted these days, with stocks stringing together alternating stretches of impressive gains and worrisome losses. Successful investing requires having a plan and no small amount of bravery to stick with it. In this #MacroMemo, we review several sources of recent economic weakness, think about what a recession might look like, and refresh the U.S. election outlook.
Economic weakness
- Markets were jolted by the arrival of twin underperforming Institute for Supply Management (ISM) indices last week.
- The ISM Manufacturing Index landed first:
- It fell unexpectedly in September, from a weak 49.1 to a weaker 47.8. For context, any reading below 50 indicates a manufacturing sector in decline.
- The market consensus had been for a rebound to 50.0, whereas we had highlighted the risk of disappointment.
- Related leading indicators such as the CEO business confidence index, new export orders and the new orders to inventories ratio highlight the risk that the measure may continue to decline (not to mention the long downward trend already in place).
- This is indisputably bad news, pointing to a further deceleration in GDP growth and increasing the market-assessed odds of an October 30 rate cut (from 40% pre-release to 72% today).
- For those in search of silver linings, we highlight that the ISM Manufacturing Index normally descends into the low 40s before an economy wide-recession occurs, and it normally bottoms in the high 30s. The latest reading is still fairly distant from that, and only slightly worse than the levels recorded in 2016 and 2012 – neither of which culminated in economy-wide recession.
- Whereas the manufacturing sector is already in recession, non-manufacturing businesses have generally held up better. In so doing, they have helped to prevent an economy-wide recession. Illustrating this, the ISM Non-Manufacturing Index for September remains above the 50 threshold, at 52.6. However, it is also in decline, having tumbled from 56.4 the month before. Naturally, the service sector is less directly exposed to tariffs and many of the sub-industries enjoy fairly smooth operations by virtue of inherently stable demand (such as for medical care and telecommunication services).
- Fortunately, the U.S. economy failed to deliver the trifecta of doom that everyone was dreading: the twin ISM disappointments were NOT followed by a weak payrolls report on Friday. Instead, U.S. job creation was a tolerable +136K in September, with a moderate upward revision to prior months and the lowest unemployment rate in half a century (3.5%). Wage growth is slipping, but the overall story is one of ebbing job growth that is still managing to fully absorb new entrants.
European weakness
- One curiosity in the saga of diminishing global growth is that the Eurozone has arguably been hit harder than the U.S. Of all places, Germany – normally the economic powerhouse of Europe – is on the cusp of technical recession.
- This is initially counterintuitive to the extent that U.S. protectionist actions have played a key role in the global economic slowdown, and Europe has not – until very recently, at least – been in the tariff crosshairs.
- So why has Eurozone growth been hit so badly?
- Eurozone growth was unsustainably fast in 2017 and early 2018, to an even greater extent than the U.S. While both enjoyed year-over-year growth that peaked in the vicinity of 3%, the U.S. sustainable growth rate is up to a percentage point faster than that of the Eurozone. In other words, the Eurozone was growing even more unsustainably quickly than the U.S., making it especially prone to a sharp economic pullback. Indeed, this has happened.
- Explaining the differential in sustainable growth rates, the Eurozone suffers from worse demographics and weaker productivity growth than the U.S. Adding to this, the U.S. continues to enjoy the tailwinds of its recent deregulatory efforts, even if the boost from tax cuts is now already baked in.
- While U.S. political developments are capturing headlines, let us not forget that the Eurozone has its own political hot potatoes to handle, including Brexit, a migrant debate and a smattering of populist governments.
- Although the U.S. tariff effort has been focused on other countries, it and other key policy questions create anxiety among businesses everywhere (see chart below).
Global economic policy uncertainty at all-time high
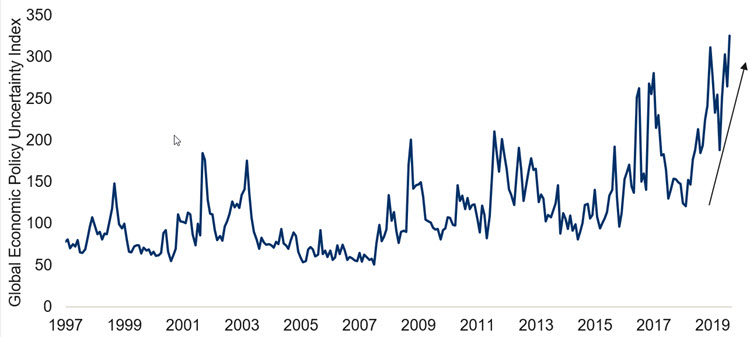
Note: As of Aug 2019. Mean of current price GDP-weighted index from 1997 to 2015 = 100. Source: www.policyuncertainty.com, Macrobond, RBC GAM.
- The all-seeing eye of the U.S. tariff effort is seemingly turning toward Europe, with:
- a recent World Trade Organization (WTO) ruling permitting $7.5 billion of U.S. tariffs to be applied legally against the European Union
- broader trade negotiation suffering a rocky start (particularly in comparison to the smooth sailing managed by Japan)
- the threat of auto tariffs that could become real in mid-November.
- The European economy is disproportionately reliant on the auto sector. It represents 4% of GDP and 6% of the EU’s employment. The EU auto sector is vulnerable to the aforementioned tariff threat and was already struggling in the face of anemic global demand:
- Industry experts note that auto demand is falling in 12 of the world’s 15 largest auto markets, with sales plausibly on track to decline by more than 5% this year. For context, the 2008—2009 global financial crisis saw a mere 3.6% drop.
- The threat of U.S. tariffs (of between 5% and 25%) on imported vehicles would crimp the 29% of EU car exports that are currently sold into the U.S. Roughly one in six cars produced in the U.S. are European brands, with Germany responsible for over half of these.
- European car makers also arguably made some poor bets, including an ill-advised environmentally-motivated push toward diesel rather than electric. In some cases their competitiveness has also been undermined by European industrial policies.
- Europe’s economy is much more reliant on Chinese demand than is the U.S. In 2018, the Eurozone exported $199 billion of products to China, whereas the U.S. merely exported $120 billion. As a result, China’s long-standing structural slowdown, plus the more recent damage done by U.S. tariffs, have a disproportionate knock-on effect against the Eurozone.
With contribution from Vivien Lee
U.S. election update
- The U.S. election is now just 13 months away.
- Much has happened over the past few weeks as impeachment investigations have complicated President Trump’s push for a second term and Democratic frontrunners Joe Biden and Bernie Sanders have been undermined by their links to the Ukraine and serious health issues, respectively.
- Accordingly, Democrat Elizabeth Warren has continued her remarkable ascent in the polls.
- Fascinatingly, despite a still crowded field of Democratic Party candidates, Warren is now viewed by betting markets as having a greater likelihood of capturing the Democratic nomination than all of her competitors combined. In contrast, she was mired in single digits earlier in the year. With many months left in the nomination race this is hardly definitive, but it is certainly something.
- Arguing that the race is not yet over, Biden enjoys the most endorsements, followed by Kamala Harris and Corey Booker. Warren is merely in fourth by this metric, with less than half of Biden’s support. However, we suspect endorsements become incrementally less important from one election to the next. Supporting this view, Bernie Sanders did very well in the 2016 primaries without many endorsements.
- When betting markets are asked who is most likely to win the White House – irrespective of party – the answer continues to be President Trump (see chart below). Being the incumbent is an enormous advantage. However, note that the combined likelihood of the various Democrats winning the presidency is well above that of Trump, and somewhat above 50%.
Trump has the highest chance of winning 2020 U.S. presidential election
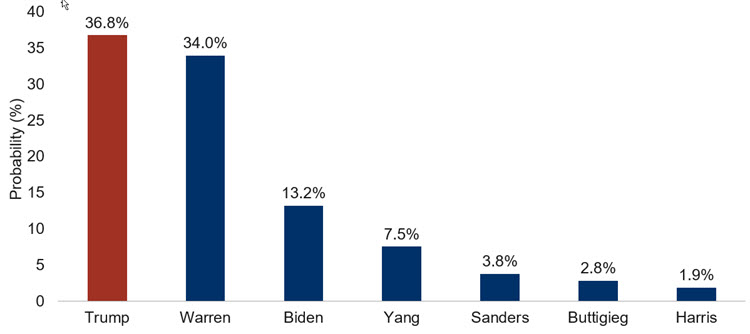
Note: As of 10/3/2019. Source: Predictit; RBC GAM.
- Keep in mind that there is a non-zero chance of another Republican being selected as the party’s candidate, either in a scenario in which Trump is impeached and then convicted by the Senate, or if a primary challenger gains sufficient support.
- Although the Democrats may hold a slight advantage in their quest for the White House, nothing is over yet. President Trump defied the odds in his 2016 victory. Betting markets generally acknowledge he has a better chance of victory than polling would otherwise suggest.
- Who would financial markets prefer as president?
- No one has captured the market’s imagination in the sense that the race seems likely to pit a right-leaning populist against a far-left candidate. Markets generally prefer centrist or centre-right politicians. There simply isn’t anyone fitting that description this election.
- While President Trump did deliver tax cuts and deregulation – to the stock market’s delight – his more recent protectionist push, immigration restrictions and the pervasive policy uncertainty have been unpopular with businesses.
- Senator Warren is running on an unabashedly anti-big business campaign, pledging to raise corporate taxes, reintroduce Glass-Steagall to break up banks, ban oil fracking, break apart tech giants, break up agribusinesses and nationalize the health care industry. Whatever the redeeming social value of some of those policies, they would not be celebrated by financial markets.
- Of course, U.S. presidents are greatly restricted by Congress. Given present polling for Senate and House races, it is likely that the Senate will remain in Republican hands and the House of Representatives will remain with the Democrats. In turn, plans to radically expand or shrink the size and nature of the U.S. government are unlikely to be delivered in full, if at all.
Thinking more deeply about recessions
- We continue to believe the risk of a U.S. recession over the next 12 months is around 40% – considerably higher than normal, but not the most likely scenario. The recent decline in the ISM Manufacturing Index is arguably nudging it slightly upwards.
- It is worth thinking for a moment about what such a recession might look like, if triggered. Here are three key thoughts.
- A recession would likely be global in nature rather than isolated in a handful of markets:
- Even as tariffs begin to fray the connections between nations, the global economy is interconnected to a greater extent than during any prior recession. An economic contraction in one major market would easily spread into the others by virtue of trade ties, financial flows and mutual confidence responses.
- The economic deceleration already underway is global in nature, spanning such prominent markets as the U.S., China and Europe. This supports the thesis that economies are highly interconnected at present. It also means that each is unusually vulnerable to negative shocks emanating from the others.
- We believe the next recession will be shallower than the last one:
- This is not exactly a bold claim as the global financial crisis of 2008—2009 represented an unusually deep contraction. The average recession is not so bad.
- While there are indisputably some financial and debt excesses in the world today, we don’t see enough dry tinder to create a full-on balance sheet recession akin to 2008—2009. Rather, a classic (and milder) business-cycle recession is more likely – one in which moderate economic excesses are worked out of the system without bringing the banking sector or major debt markets to their knees.
- Mathematically, even an economic contraction of the same magnitude as past recessions would technically be milder today since the normal rate of growth today is somewhat less than it was in the 2000s. To illustrate, if “normal” today is 2.25% growth versus 3.00% in the past, then a 1% YoY decline in GDP represents an underperformance of 3.25 percentage points today, versus 4 percentage points in the past. Thin gruel, perhaps, but still worth acknowledging.
- We assume that the recovery from the next recession will take longer than normal, at least relative to the normal recovery for a recession of that size:
- The most recent recession took unusually long to recover from, despite powerful policy support.
- Today, policymakers have less ammunition than usual. Interest rates are already very low and public debt loads are quite high.
- The divided Congress in the U.S. makes it particularly tough to deliver U.S. fiscal stimulus, and stricter European fiscal rules make it hard for large-scale stimulus there. China remains mostly unencumbered, but also has a higher public debt level than in the past.
- But we also want to emphasize that policymakers are not completely out of options.
- Interest rates have not yet hit bottom in the U.S.
- There is still room for more quantitative easing almost everywhere (and plenty of it if central banks were to innovate and consider buying other asset classes).
- Ultra-low rates redefine the limits of government borrowing. Talk of Modern Monetary Theory is more exotic but arguably unnecessary at a time when central banks are printing money and government borrowing costs are near zero.
- A recession would likely be global in nature rather than isolated in a handful of markets: