J’ai été frappé de constater récemment tout le temps que j’ai dû passer à chercher le terrain de golf idéal, alors que je ne suis même pas un adepte de ce sport. Suis-je masochiste ? Aucunement. C’est simplement que les chalets sont des endroits rêvés pour organiser des présentations aux clients. En fait, mon manque d’intérêt pour ce sport est sans doute une bonne chose, puisque ma modeste collection de trophées ne comprend que celui du « golfeur le plus honnête », obtenu durant l’une des deux seules parties que j’ai jouées.
La plus récente, d’ailleurs, a été assez étonnante, dans la mesure où, même si elle s’est déroulée au début du mois de novembre, un tapis de neige recouvrait déjà le terrain. On peut imaginer qu’une arrivée précoce de l’hiver n’est jamais en soi une bonne nouvelle, surtout pour les golfeurs, mais le contraste entre la blancheur de la neige et les couleurs vives des feuilles encore accrochées aux branches offrait un spectacle d’une rare beauté.
Repères économiques :
- Notre plus récent numéro de Repères économiques peut maintenant être consulté en ligne : Survol des taux d’intérêt faibles ou négatifs.
Quel est le volume des capacités inutilisées ?
- Les économistes consacrent un temps fou à observer l’évolution des capacités inutilisées dans les économies. Les « capacités inutilisées » ne sont qu’une autre expression pour décrire l’écart de production, lequel mesure la différence entre la production réelle d’une économie et sa production potentielle durable.
- Un écart de production négatif signifie qu’une économie ne roule pas à plein régime, alors qu’un écart de production positif signifie que l’économie fonctionne au-dessus de sa capacité. Vous pensez peut-être que ce deuxième scénario ne se produit jamais, et vous n’avez pas tout à fait tort ; il ne se produit en fait que pendant de courtes périodes, juste avant que l’économie ne surchauffe et n’entre en récession, moment où l’offre redevient excédentaire.
- Il est important d’évaluer le volume des capacités inutilisées pour différentes raisons. Ces estimations permettent d’établir la marge de manœuvre dont dispose l’économie pour croître rapidement, la latitude dont disposent les décideurs politiques pour lancer des mesures de stimulation et, plus important encore, elles permettent d’établir la phase dans laquelle se trouve le cycle économique.
- Malheureusement, l’écart de production ne peut pas être observé directement. Seules des estimations sont possibles, en se fondant sur le taux de chômage ou le taux d’utilisation de capacité, ou encore en mesurant le décalage entre les données réelles et les taux de croissance tendanciels utilisés pour déterminer si l’économie est en surchauffe ou en sous-régime.
- Trois institutions ont tenté de calculer l’écart mondial de production : la Banque mondiale, le FMI et l’OCDE. La seule institution qui a calculé un écart résolument mondial est la Banque mondiale. Les deux autres se concentrent principalement sur les pays développés. Ce n’est pas par excès de paresse, puisqu’il est très difficile de quantifier les capacités excédentaires des économies émergentes. Les principales raisons qui expliquent ces complications sont l’envergure de l’économie parallèle (généralement non mesurée) et, par le fait même, la grandeur des capacités excédentaires latentes dans les pays dont l’urbanisation à grande échelle reste inachevée. Par rapport aux autres mesures, celle de la Banque mondiale est malheureusement dépassée et ses antécédents ne remontent pas aussi loin. Par conséquent, nous nous appuyons sur les trois mesures, compte tenu de leurs forces relatives (voir la première figure).
-
L’économie mondiale a dépassé son potentiel
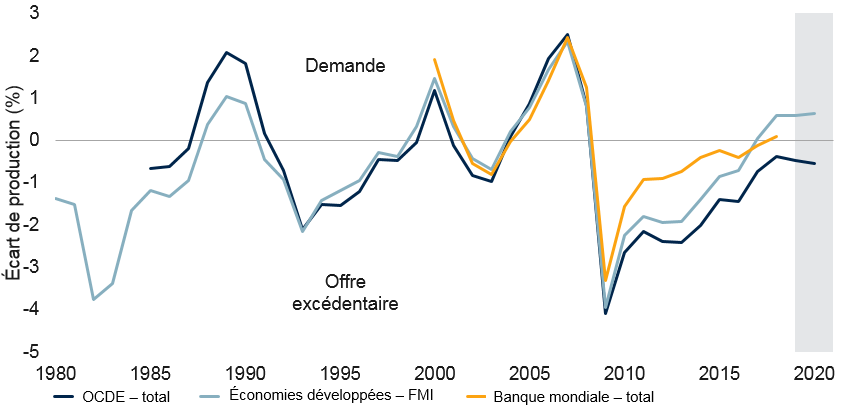
Nota : Données correspondant au PIB réel moins le PIB potentiel, en pourcentage de ce dernier. La zone grisée représente la prévision du FMI (octobre 2019) et de l’OCDE (mai 2019). Sources : FMI, OCDE, Banque mondiale, Haver Analytics, RBC GMA.
- Selon chacune de ces mesures, le rendement de l’économie mondiale demeure légèrement inférieur, est légèrement supérieur ou est à peine supérieur à son potentiel, selon le cas.
- De façon générale, ces mesures permettent de conclure que l’économie mondiale a pratiquement atteint son plein potentiel ou qu’elle l’a légèrement dépassé.
- Passons maintenant aux États-Unis, qui, par le passé, ont servi de baromètre économique, en plus d’être le point zéro de bon nombre de récessions mondiales.
- Force est de constater que l’économie américaine tourne plus vite que l’économie mondiale : parmi les trois mesures principales (FMI, OCDE et Congressional Budget Office), deux démontrent un rendement supérieur au potentiel, tandis que l’autre reflète un rendement à peine inférieur à son potentiel. La moyenne collective de ces mesures est de +0,8 pp, ce qui signifie que l’économie dépasse concrètement son potentiel durable (voir le graphique suivant).
-
Écart de production des États-Unis – Sommet historique par rapport à aujourd’hui
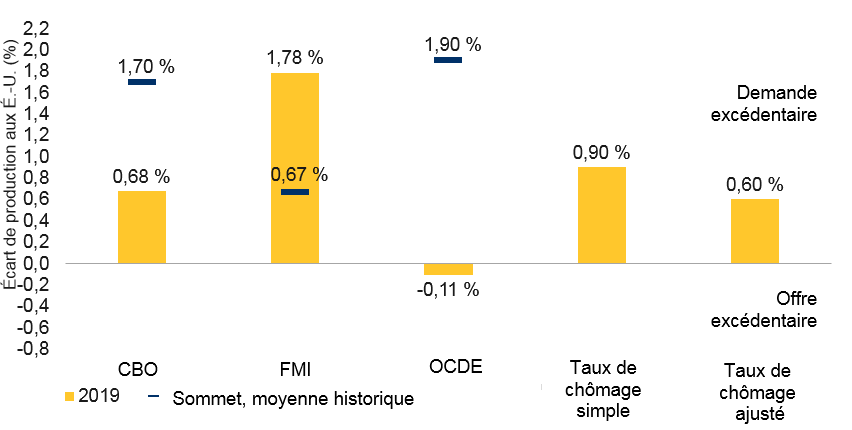
Nota : La moyenne des sommets des écarts de production pour chaque période d’expansion est estimée en fonction des données du CBO à partir de 1950, du FMI à partir de 1980 et de l’OCDE à partir de 1991. Les écarts de production estimés par RBC GMA sont fondés sur la loi d’Okun à partir de données sur le chômage réelles et ajustées à la démographie. Sources : CBO, FMI, OCDE, Macrobond, RBC GMA.
- Cela dit, en règle générale, les économies ne s’effondrent pas dès qu’elles ont atteint leur potentiel. Par le passé, elles ont plafonné lorsque l’écart s’est établi en moyenne à +1,4 pp. Voilà qui porte à croire que l’économie américaine a encore de beaux jours devant elle, même si techniquement parlant, elle est déjà en surchauffe.
- Toutefois, le débat est loin d’être clos pour deux raisons :
- Il existe des arguments contradictoires au sujet de la tendance haussière ou baissière de ces mesures des écarts de production.
- Selon la « théorie du pincement de la corde de guitare » du cycle économique, proposée en premier lieu par Milton Friedman, les conditions économiques ne seraient pas aussi tendues qu’on pourrait le croire. Cette théorie est contraire au point de vue actuel selon lequel l’écart de production est aussi souvent supérieur qu’inférieur au potentiel. Elle avance plutôt que l’économie est parfois poussée bien en dessous de son potentiel à cause d’une récession, puis qu’elle y rebondit par la suite (sans généralement le dépasser). Si cette théorie se révèle juste, l’économie américaine n’a pas surpassé son potentiel, mais serait sur le point de l’atteindre. Ce concept nous semble intéressant, puisque nous n’avons jamais été friands de l’idée selon laquelle les économies pouvaient dépasser leur potentiel de manière continue. Si c’était réellement possible, le potentiel en question serait plus élevé que nous l’avions imaginé.
- Une autre théorie veut que les conditions économiques soient plus tendues qu’on l’imagine au départ, car les estimations des écarts de production sont généralement révisées à la hausse par la suite. En d’autres termes, on apprend après coup qu’une économie qui semblait évoluer en deçà de son potentiel l’avait atteint. De même, on peut apprendre qu’une économie qui semblait fonctionner à son plein potentiel était plutôt en surchauffe. Cette situation est surtout évidente aux derniers stades du cycle. Par conséquent, lorsque les statisticiens réévalueront l’écart de production estimatif moyen, actuellement de +0,8 pp, ils pourraient très bien conclure qu’il était déjà conforme aux sommets passés.
- Pouvons-nous concilier ces interprétations en apparence contradictoires ? Oui. En ce qui concerne les niveaux, l’argument qui nous convainc le plus est le premier, selon lequel les conditions économiques absolues ne sont pas aussi tendues qu’on pourrait le croire. Il est possible que l’économie américaine ne tourne pas à un rythme supérieur à son potentiel. Cependant, il faut garder à l’esprit que cette théorie devrait également s’appliquer aux cycles passés. Aucun de ces cycles n’avait vraisemblablement atteint le niveau de surchauffe estimé selon les méthodes traditionnelles. Pourtant, le simple fait d’atteindre le plein potentiel a rendu les économies suffisamment fragiles pour les faire tomber en récession. Le risque de récession demeure donc le même. Parallèlement, l’élément central du deuxième argument veut que, abstraction faite des niveaux, l’économie soit plus près de la limite de ses capacités qu’on l’imagine par rapport aux sommets des cycles passés (peu importe le degré absolu de l’écart de production). Il en ressort que le cycle économique est peut-être plus avancé qu’on l’imaginait.
- Pour renforcer les estimations des écarts de production, nous pourrions trouver de nouvelles façons de mesurer les capacités excédentaires.
- Un examen sommaire révèle que le taux de chômage aux États-Unis est devenu extrêmement bas et qu’il n’a jamais été aussi faible depuis une cinquantaine d’années (voir le graphique suivant). Selon une estimation moderne fondée sur la loi d’Okun (avec un coefficient de 1,0) et l’hypothèse d’un taux de chômage naturel de 4,5 %, l’économie américaine dépasserait son potentiel de +0,9 pp, soit un résultat encore plus élevé que la moyenne des autres mesures.
-
Il est important d’éviter une surchauffe du marché de l’emploi aux États-Unis
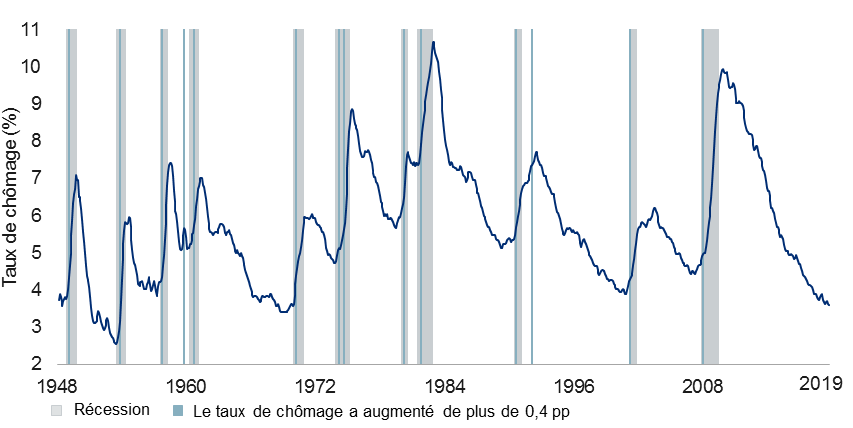
Nota : En date d’octobre 2019. Moyenne mobile sur trois mois du taux de chômage. Sources : Bureau of Labor Statistics, NBER, Haver Analytics, RBC GMA
- Cependant, cette approche fait souvent l’objet de critiques, car elle ne tient pas compte du fait que le taux de chômage exclut les chercheurs d’emploi découragés. Ces personnes étaient nombreuses à la suite de la crise financière mondiale, comme le montre l’importante chute du taux d’activité, qui est passé d’un sommet de 66,2 % pour s’établir à seulement 62,3 %. Heureusement, ce taux s’est partiellement redressé depuis et atteint maintenant 63,3 %. De plus, une grande partie du recul initial est imputable au vieillissement de la population (augmentation du nombre de retraités) plutôt qu’aux demandeurs d’emploi découragés. En effet, notre taux d’activité ajusté en fonction de la démographie a remonté pour atteindre 65,8 %, rattrapant ainsi presque tout le terrain perdu.
- Notre taux de chômage ajusté en fonction de la démographie est quant à lui de 3,9 %. Ce résultat est presque aussi favorable que le taux officiel de 3,6 %, ce qui correspond à un recul considérable par rapport à l’immense écart de trois points de pourcentage qui existait auparavant (voir le graphique suivant).
-
Le taux de chômage aux États-Unis est presque aussi reluisant qu’il le paraît
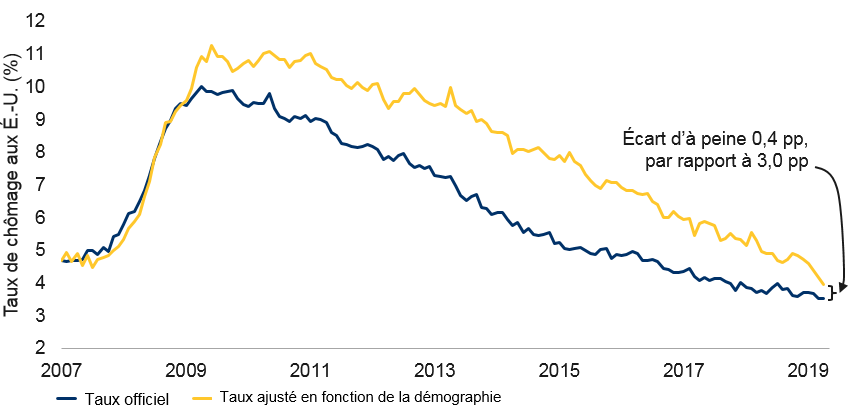
Nota : En date d’octobre 2019. Le taux ajusté en fonction de la démographie tient compte de la diminution du taux de chômage et du taux d’activité attribuable au vieillissement de la population. Sources : Haver Analytics, RBC GMA
- Une fois converti en équivalent d’écart de production, ce taux de chômage ajusté en fonction de la démographie représente un écart de +0,6 point de pourcentage. Il s’agit toujours d’une situation de demande modérément excédentaire (se reporter au graphique à barres précédent).
- Cela dit, beaucoup d’autres difficultés font du taux de chômage une donnée imprécise, comme le montre notamment une étude réalisée par la Réserve fédérale américaine en 2017 qui indique que 17 % des personnes inactives participent tout de même à l’économie à la demande. Les autres facteurs comprennent l’accroissement de la proportion de jeunes dans la vingtaine qui ne sont pas sur le marché du travail et qui poursuivent des études postsecondaires, l’augmentation du nombre de travailleurs à temps partiel, le relèvement de l’âge de la retraite, etc.
- L’une des stratégies pour essayer d’éliminer ces complications est de mettre de côté le taux de chômage et de simplement tenir compte des heures travaillées au sein de l’économie par rapport au nombre de personnes en âge de travailler (voir le graphique suivant).
-
Aux États-Unis, le nombre d’heures travaillées par personne est de plus en plus élevé
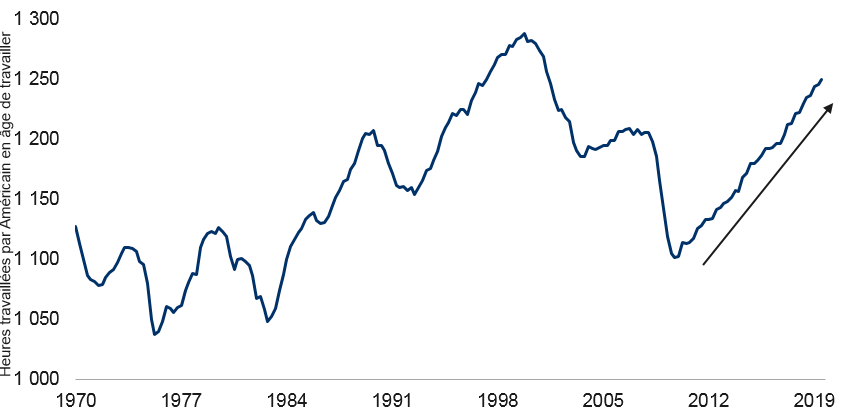
Nota : Au T3 de 2019. Sources : Macrobond, RBC GMA
- Il existe des arguments contradictoires au sujet de la tendance haussière ou baissière de ces mesures des écarts de production.
- D’après cette mesure, le marché de l’emploi aux États-Unis serait maintenant plus tendu qu’il ne l’a jamais été, hormis durant le cycle de l’an 2000. Bien qu’elle ne soit peut-être pas mauvaise, cette estimation est imparfaite en ce sens que la mesure tient compte du total des heures travaillées, mais le divise ensuite par le nombre de personnes âgées de 16 à 64 ans. Puisque de nombreux travailleurs ont 65 ans et plus (la taille de ce groupe augmente en valeur absolue et compte une proportion grandissante de travailleurs en valeur relative), cette mesure exagère probablement la tension sur le marché du travail. De même, compte tenu de l’augmentation structurelle de l’emploi formel des femmes dans la deuxième moitié des années 1990, il n’est peut-être pas étonnant que les données soient plus élevées aujourd’hui que par le passé. Finalement, il n’y a pas de mesure parfaite.
- Que faut-il en conclure ? L’idée maîtresse est qu’il y a plusieurs mesures des capacités inutilisées qui signalent toutes que l’économie américaine se situe très près de ses sommets historiques. Dans ce contexte, même si l’accentuation de la courbe des taux montre de façon convaincante que le risque de récession à court terme a diminué, d’autres mesures plus persistantes comme l’écart de production indiquent que le cycle économique n’est pas entièrement revenu à la case départ.
Résumé de la situation commerciale
- En matière de commerce, les bonnes nouvelles demeurent plus nombreuses que les mauvaises.
- Étonnamment, les médias ont peu parlé de l’approbation provisoire par 15 des plus grands pays d’Asie d’un nouvel accord commercial majeur, le Partenariat économique régional global (RCEP).
- L’entente, qui doit être ratifiée au début de 2020, s’applique à une part remarquable de 30 % de l’économie mondiale. Parmi les pays participants, on trouve des géants tels que le Japon, la Chine, la Corée du Sud et l’Australie.
- La participation de l’Inde était attendue, mais le pays s’est retiré à la dernière minute.
- Voici deux autres réflexions à ce sujet.
- Premièrement, même si la mondialisation n’a plus le vent en poupe, elle ne connaît pas non plus de recul généralisé. Outre le RCEP, d’autres accords importants ont été conclus récemment, parmi lesquels l’Accord de Partenariat transpacifique global et progressiste (PTPGP), qui est entré en vigueur auparavant, et divers nouveaux partenariats que l’UE a noués séparément avec le Canada, le Mexique et le Japon.
- Deuxièmement, le recalibrage des forces à l’échelle mondiale se poursuit. Alors que les États-Unis se retirent de la scène commerciale mondiale, d’autres pays vont de l’avant.
- En ce qui concerne l’accord commercial entre les États-Unis, le Mexique et le Canada, la ratification de l’entente par les États-Unis semble de plus en plus plausible. En effet, la présidente démocrate de la Chambre des représentants, Nancy Pelosi, a tenu des propos qui portent à croire que les politiciens américains sont sur le point de s’entendre sur les mécanismes de mise en application visant à garantir que le Mexique respecte les lois liées au travail et à l’environnement. Une nouvelle approbation du Mexique serait alors nécessaire, ainsi qu’une ratification finale par le Canada, mais ces deux éventualités semblent probables.
- Les tarifs américains sur l’automobile ont été reportés pour l’instant. Il est à souhaiter que le report soit définitif, car les États-Unis cherchent déjà à conclure des accords commerciaux plus complets avec presque tous les grands pays qui vendent des automobiles aux États-Unis (Japon, Corée du Sud, Mexique, Canada, UE).
- Les négociations entre les États-Unis et l’Europe demeurent plutôt calmes.
- Enfin, la relation commerciale entre les États-Unis et la Chine s’est certainement améliorée au cours des derniers mois, les discussions relatives à un accord partiel prenant de l’ampleur. À tout le moins, les hausses tarifaires prévues ont été reportées, ce qui est une victoire en soi. Nous croyons que la hausse des droits de douane du 15 décembre sera également repoussée. Il semble probable qu’un accord commercial minimaliste sera conclu, ce qui se traduira par l’achat de davantage de produits agricoles américains par la Chine. Cette perspective est d’autant plus plausible que les États-Unis cherchent à relancer la croissance économique à l’approche des élections de 2020. Toutefois, nous sommes sceptiques quant à la ratification d’un accord plus vaste et substantiel, compte tenu de la persistance des différends au sujet des mécanismes de mise en application, des pratiques en matière de propriété intellectuelle et des entreprises d’État.
Voyons maintenant différents points intéressants...
Faibles données économiques en Chine
- La Chine a publié de faibles données économiques pour octobre. Les ventes au détail et la production industrielle ont été inférieures aux attentes, n’ayant augmenté respectivement que de 7,2 % et 4,2 % sur douze mois. Ces données sont basses pour le pays, d’autant plus qu’il s’agit de chiffres nominaux et non d’estimations corrigées de l’inflation.
- Quant à savoir si les mesures de relance prises précédemment par la Chine commencent à faire effet, la situation est moins claire qu’elle ne l’était. La solide croissance de la masse monétaire M2, qui s’établit à 8,4 %, continue de progresser, mais la croissance du crédit a ralenti. Il faut toutefois dire que d’importants facteurs saisonniers expliquent ce ralentissement et que la tendance demeure légèrement à la hausse. Dans tous les cas, le paysage s’est un peu assombri.
- Signalons à tout le moins que la possibilité de voir la Chine prendre d’autres mesures de relance économique représente un risque considérable de hausse à l’égard de nos prévisions.
Le Japon promet des mesures de relance budgétaire
- Après les rumeurs de l’été dernier et la hausse de la taxe de vente appliquée le 1eroctobre, laquelle a freiné la croissance, le premier ministre du Japon, M. Abe, a confirmé qu’il y aurait d’autres mesures de relance budgétaire à court terme.
- Nous savons peu de choses à ce sujet pour le moment.
- Mentionnons cependant que le Japon s’ajoute à la liste des pays qui choisissent de mettre en œuvre d’autres mesures de relance budgétaire. Effectivement, la Chine, l’Inde, l’Allemagne et les Pays-Bas ont déjà fait le saut. D’autres pays suivront sans doute.
La course à l’investiture du parti démocrate
- La possibilité que Michael Bloomberg, ancien maire de New York, brigue l’investiture du parti démocrate a suscité l’enthousiasme sur les marchés financiers, M. Bloomberg étant pour eux un candidat idéal : un centriste pragmatique ayant une solide expérience du monde des affaires.
- Il n’a pas encore rien annoncé, mais le dossier de candidature qu’il a soumis récemment en Alabama est le geste le plus concret en ce sens qu’il ait posé jusqu’à maintenant.
- Les marchés de pari lui donnent tout au plus 7 % des chances de remporter l’investiture. Son entrée tardive dans la course est en cause, tout comme l’est le fait que les démocrates semblent privilégier actuellement des candidats plus à gauche et que Joe Biden et lui pourraient se disputer le vote des modérés. À ce propos, nombreux sont ceux qui pensent qu’il ferait le jeu d’Elizabeth Warren s’il se présentait officiellement.
- En effet, Mme Warren est toujours en tête avec 26 % des chances de devenir la candidate démocrate aux présidentielles, suivie de Joe Biden à 23 % et de Pete Buttigieg, en pleine ascension, à 21 %. Cela dit, les chances de Mme Warren ont déjà été supérieures à 50 %. La course est donc loin d’être terminée.
Audiences sur la mise en accusation du président Trump
- Les audiences sur la mise en accusation du président Trump, menées par les démocrates, sont en cours. Selon les parieurs, les probabilités que la Chambre des représentants mette Donald Trump en accusation d’ici la fin de son mandat sont de 79 %. Cependant, ces mêmes parieurs estiment à 6 % les probabilités que M. Trump ne soit plus président à la fin de 2019. Ils estiment donc qu’il y a peu de chances que le Sénat lance la procédure de destitution.
- Selon nous, les probabilités d’une mise en accusation sont encore plus élevées, et celles d’une destitution, plus faibles.
La Suède annule sa politique de taux négatifs
- Malgré la faiblesse économique persistante et l’assouplissement généralisé ailleurs dans le monde, la Suède a choisi de revoir sa politique de taux d’intérêt négatifs.
- Il s’agit d’un changement de philosophie, le pays estimant maintenant que les taux d’intérêt négatifs pourraient causer plus de mal que de bien.
- Nous sommes d’accord avec cette évaluation ; les distorsions causées par les taux négatifs sont telles qu’il est sans doute préférable que les banques centrales ne s’aventurent pas sous la barre du 0 %.
- Faut-il maintenant s’attendre à ce que d’autres banques centrales, comme celle du Japon et de l’Europe, délaissent les taux négatifs ? Sans doute pas à brève échéance, mais elles ne baisseront probablement pas davantage leurs taux. Selon nous, ce changement de philosophie réduit les probabilités, déjà minces, que les États-Unis, le Royaume-Uni ou le Canada fassent passer leurs taux en territoire négatif, même si la situation économique devait grandement s’aggraver.