Monthly economic webcast:
Our latest webcast, entitled “COVID-19 goes global” is now available. Note that it was recorded on March 27.
COVID-19 summary
The COVID-19 virus continues its global spread, though the outbreak in Europe may be starting to stabilize.
Financial markets have become slightly less volatile and less uniformly sour, though risk assets remain sharply lower than pre-COVID-19.
For the first time in several weeks, we have not been compelled to take a knife to our GDP forecasts – surely a small victory. We took advantage of the reprieve by enhancing our thinking on a range of related macro subjects. A deep, though hopefully brief, recession is now very much underway.
Latest virus numbers
The world now contains more than 700,000 COVID-19 infections, this figure having more than doubled over the past week. The most recent day logged 58,520 cases alone (see chart).
COVID-19 spreading rapidly
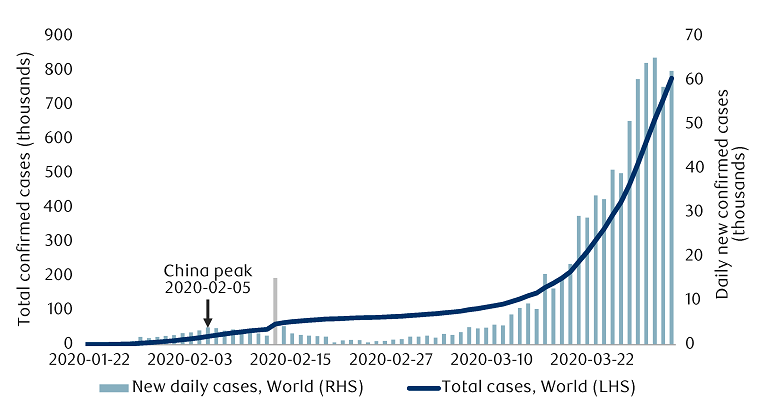
Note: As of 03/30/2020. Spike on 02/17/2020 due to methodology change. Source: ECDC, Macrobond, RBC GAM
China and South Korea continue to prove that it is possible to contain the virus, though the more tentative success previously associated with Singapore and Japan is now debatable as both are suffering a surge of additional cases.
The epicenter of the disease had initially shifted from China to Europe. While Europe remains intensely affected by COVID-19, the focal point has arguably pivoted again, this time toward North America (see chart). The U.S. is having the most difficult time, and the Canadian caseload also continues to expand.
Trajectory of COVID-19 cases in different countries
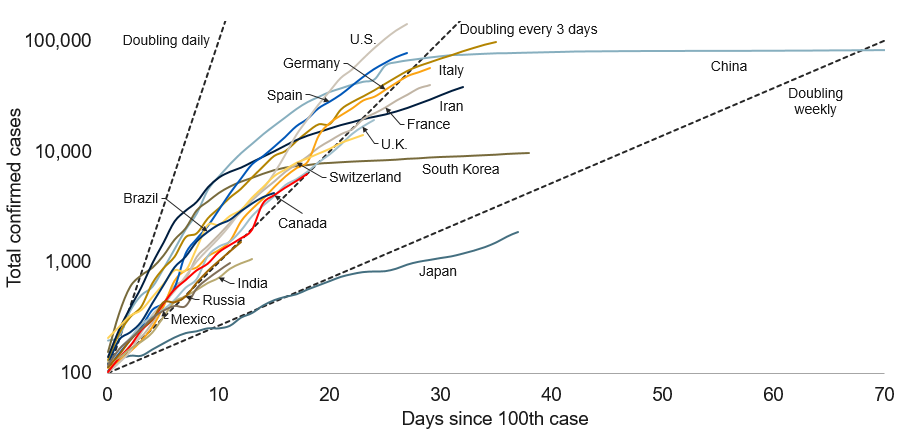
Note: As of 03/30/2020. Dashed lines represent slope at which cases double every day/3 days/week. Source: ECDC, Macrobond, RBC GAM
Intriguingly, the latest daily data actually argues that the entire world saw slightly fewer new cases than the day before. This is unlikely to represent the true global peak for a variety of reasons, but it is worth highlighting in the event that we are wrong.
Italian stabilization
Italy has been the bellwether developed country for COVID-19. It suffered a particularly early and intense hit, and has since been one to two weeks ahead of other developed nations both in terms of its caseload and its policy response.
We speculated in our last weekly note that Italy should have been experiencing a peak in its number of new cases per day around that time, and the evidence a week later appears to back that up. The trajectory is hardly smooth, but the country has now logged eight consecutive days below its peak set on March 22 (see chart).
Spread of COVID-19 in Italy
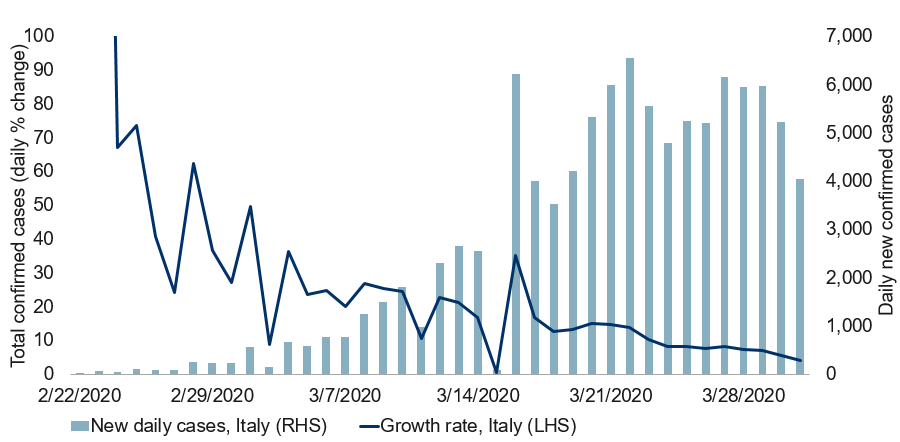
Note: As of 03/30/2020. Source: ECDC, Macrobond, RBC GAM
Accordingly, Italy now has a transmission rate that is finally flirting with 1, and could descend below this critical threshold in the coming days (see next chart).
Transmission rate above one suggests continued growth (based on new cases)
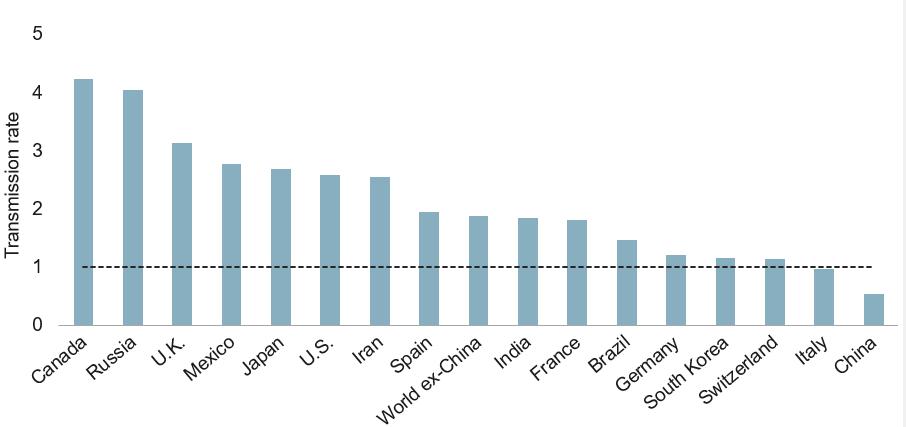
Note: As of 03/30/2020. Transmission rate calculated as 7-day % change of underlying 5-day moving average of new daily cases. Source: ECDC, Macrobond, RBC GAM
Should Italy’s peak hold, it would mean that the country peaked 14 days after implementing its hard quarantine. This is very similar to the 13 days that China required. Furthermore, Spain has now tentatively peaked as well (on March 27), 13 days after instituting its own hard quarantine.
By extension, we continue to hypothesize that based on the starting date for their respective quarantines, the U.S., U.K. and Canada could peak this coming weekend. That said, our confidence is particularly low for the U.S. where nearly half of the country is still not subject to strict social distancing protocols. Canada’s high transmission rate in the above bar chart is likely the result of a single rogue day of data, and not overly concerning to us.
U.S. problematic
Notwithstanding the surprising decline in the number of new U.S. cases in the latest day, the U.S. trajectory has been concerning (see chart). The country recorded 18,360 new cases in the latest day, and is now up to 143,025 global cases. This puts it first in the world, and nearly twice as high as China ever reached.
Spread of COVID-19 in the U.S.
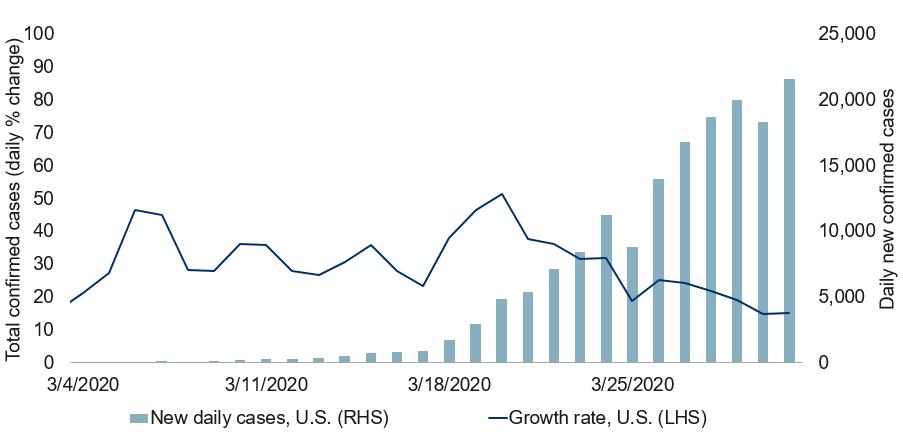
Note: As of 03/30/2020. Source: ECDC, Macrobond, RBC GAM
Some of this critical analysis is not entirely fair to the U.S. After all, the country has a much larger population than any individual European country, and its 15% daily growth rate is no different than Canada, the U.K. or Spain. Still, the U.S. merits special notice, in part because of the sheer size of its population and economy, in part because it is the world’s financial hub, and in part because its quarantining and messaging efforts have been less consistent than elsewhere.
On a more positive note, the City of Seattle – where the first serious COVID-19 cluster was uncovered within the U.S. – is now beginning to see a material improvement.
Searching for stress
Fortunately, the latest economic shock is emanating from a virus rather than the debt excesses that induced the global financial crisis. As such, it is unlikely that financial market problems on the scale of the U.S. sub-prime mortgage market will appear this time.
Nevertheless, volatile market conditions, low liquidity, substantial risk aversion and economic stress have the ability to tip already vulnerable corners of the debt and equity markets into trouble. Some businesses and households are also at risk.
Financial market areas particularly worthy of scrutiny include:
- Private lenders and private equity – known for deploying aggressive leveraging and for their illiquidity.
- The oil sector – hit by challenging market conditions, particularly exposed to high-yield debt, and suffering from a massive oil shock.
- Italian banks – because they have long been fragile, with Italy now suffering a particularly fierce hit from COVID-19.
- Financial products possessing a duration mismatch are especially vulnerable due to the need to roll short-term funding regularly.
Fortunately, most major financial institutions appear to be reasonably well situated thanks to deleveraging efforts over the past decade. Reflecting this, the credit default swap spreads of prime brokers are nowhere near as wide as during the financial crisis or during the European sovereign debt crisis. The same goes for LIBOR spreads (London Inter-bank Offered Rate).
Furthermore, central banks have been extremely proactive with a truly remarkable variety of liquidity measures intended to keep every part of the credit market running.
Turning from markets to companies, particularly vulnerable businesses include the oil sector, entertainment and tourism, real estate and retailers. But one could just as easily slice the analysis in a completely different way, highlighting the vulnerability of small businesses and the relative durability of larger businesses.
From a household perspective, the vulnerabilities naturally lie in those who work in the aforementioned sectors, those with limited savings, and those who are highly indebted. Some of this pain is already becoming visible in the labour market.
Labour market response
Just how high will unemployment rates go now that businesses are being told to close and workers are being sent home? There is actually quite a debate about this, focused around two main issues:
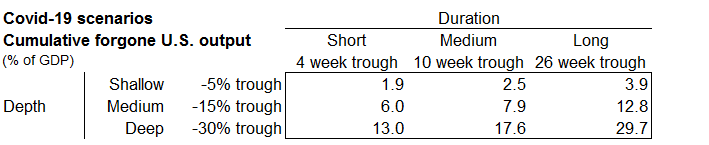
- The first relates to whether the COVID-19-induced economic decline best matches our shallow, medium or deep depth scenarios. We’ll discuss those shortly, but for the moment we will focus on the medium depth scenario.
- The second issue is whether or not the labour market will prove highly responsive to declining economic output. The financial crisis saw the unemployment rate rise roughly twice as much as was expected by conventional economic theory. Conversely, one might postulate that the temporary nature of this economic shock and the inducements put in place by policymakers should result in a notably small increase in the unemployment rate relative to the magnitude of the economic impact.
All of these issues and varying effect on the peak U.S. unemployment rate over the coming year are discussed in this table.
COVID-19 scenarios: U.S. peak unemployment rate (%)
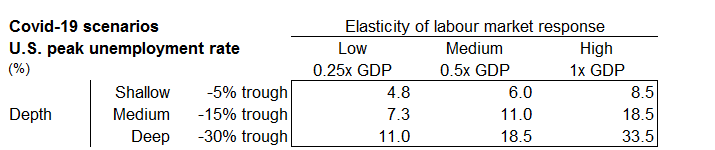
Note: As at 03/27/2020. Elasticity refers to increase in unemployment rate for every 1ppt increase in output gap. Source: RBC GAM
To summarize, a best-case outcome within the medium-depth scenario would have the U.S. unemployment rate merely rise from 3.5% to 7.3%. A historically normal labour market response would result in an 11.0% unemployment rate. A worst-case outcome using the same medium depth scenario would result in a temporary 18.5% unemployment rate peak.
Theoretically, the most optimistic of these three numbers is the most logical. Furthermore, China experienced just a 1ppt increase in its unemployment rate due to COVID-19.
That said, the remarkable spike in U.S. jobless claims to 3.3 million new applicants in a single week is worth a 1.9ppt spike in the unemployment rate all by itself, and hints that the worse outcomes are also quite possible (see chart). In the end, the 11.0% unemployment rate forecast is probably most realistic based on a combination of theory and data.
U.S. jobless claims skyrocketed as cities and states go into lockdown
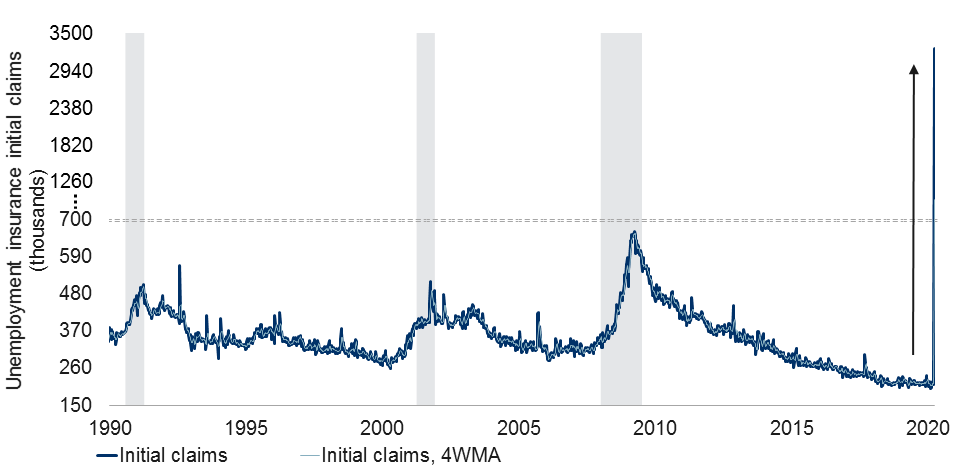
Note: As of the week ending Mar 21, 2020. Shaded area represents recession. Source: DOL, Haver Analytics, RBC GAM
But note that while the latest weekly jobless claims figure is nearly five times larger than the prior record, the comparison isn’t entirely fair, nor indicative that the unemployment rate should eventually rise to multiples of prior highs. Keep in mind that the artificial nature of this recession – businesses being told to close all at once – means that the labour market consequences should be massively front-loaded. One could imagine the bulk of the job losses accruing over the span of just a few weeks, whereas most recessions experience elevated jobless claims accruing over many dozens of weeks.
Furthermore, let us emphasize that the unemployment rates proposed in this section represent peak figures rather than a 2020 average. To the extent the economy rebounds briskly, the average unemployment rate should be considerably lower.
Finally, there are even definitional questions that could complicate the final tally. Can people really be said to be looking for a job if they aren’t allowed outside of their house and few companies have job postings? Equally, the actual unemployment rate by country could vary wildly depending on whether governments have introduced stimulus that pays displaced workers via unemployment insurance, versus subsidizing employers to keep employees on their payroll.
Depth of decline
Last week, we presented nine economic scenarios based on varying assumptions about the depth of economic decline and the breadth of any such trough.
Regarding the depth of the economic decline, we laid out the possibility that output would briefly descend by 5%, 15% or 30%.
Over the past week, we constructed a compendium of real-time economic indicators that provide some further insight into which of these constitutes the best guess. The inputs include such measures as the number of global flights, traffic congestion, restaurant reservations, the extent to which people are planning local trips, energy consumption by country and third-party credit card spending data.
None of these real-time measures are definitive, but they argue that the -5% scenario is probably too optimistic. They do not, however, definitively answer the -15% versus -30% question. The measures themselves tend to tilt toward the more pessimistic conclusion, as does the data tentatively available from China.
However, both the international and Chinese data both suffer from the same flaw: they mainly capture forms of travel and retail activity, with a pinch of industrial production. All of these sectors are known to be hit disproportionately hard by COVID-19. Other types of spending (such as fixed spending on things like mortgages) and entire sectors of the economy (such as big tech, telecom, or financial services – see our loose approximation by sector in the trailing bar chart) are not just missed but probably less adversely affected. For that matter, let us not forget that GDP measures output rather than consumption, and people working from home are producing even if they are not consuming.
As such, we are most comfortable with the medium depth scenario of a temporary 15% decline in output. Second most likely is the 30% drop, followed by the 5% drop that now looks excessively optimistic.
Medium scenario: U.S. output levels during and post-COVID-19 outbreak
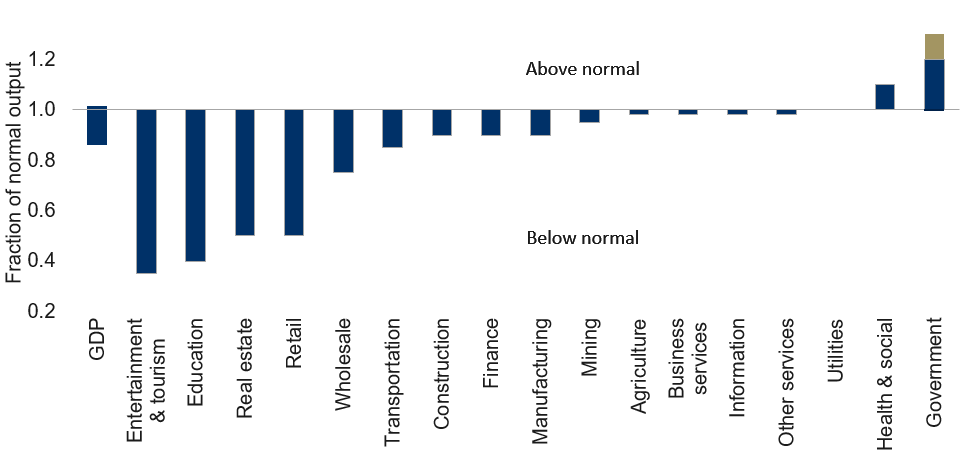
Note: Bars show peak and trough of fraction of normal output for each U.S. sector in 2020 and 2021 in a medium depth and medium duration scenario. 2019 output level = 1. Source: Haver Analytics, RBC GAM
This is not the final answer, however. More will be learned over the coming week as the real-time indicators are refreshed and as several key conventional economic indicators are released.
Duration of trough
Our nine GDP scenarios also incorporate three different lengths of time before economic growth begins to revive. The short scenario looks for a 4-week trough, the medium scenario for a 10-week trough and the long scenario for a hefty 26-week trough. For reference, week one of the U.S. trough is deemed to have begun on March 22.
The shortest scenario now looks distinctly optimistic, to the extent President Trump has already conceded that the economy will likely need to remain shuttered until the end of April. But it is not impossible, and we leave it in place as a proxy for a “quick resolution”, even if it proves slightly longer at, say, six weeks.
Most likely is the medium duration scenario of a 10-week trough. This would last through the end of May, with a rebound happening in June. China’s Hubei province played out in roughly this fashion, with 62 days between the imposition of a hard quarantine and significant relaxation of the quarantine (next chart). China arguably could have lifted the quarantine several weeks ago, which presents an upside risk for others. However, other countries have arguably not quarantined as aggressively as China, meaning it could take them longer to bring their outbreaks under control.
Spread of COVID-19 in countries with strong containment measures
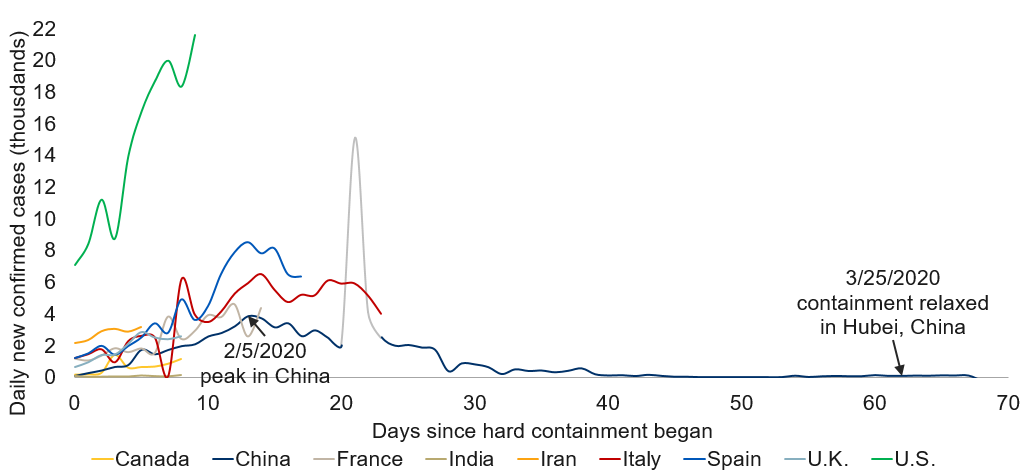
Note: As of 03/30/2020. China spike due to change in reporting methodology. Hard containment defined as a full lockdown of a significant area or population. Source: ECDC, Macrobond, RBC GAM
Finally, it is unlikely but not impossible that the economic trough lasts the long scenario’s 26 weeks.
For quarantining to end, several things will need to happen:
- There must be a significant decline in the number of new cases per day in a country. China waited a remarkable six weeks from the peak of the outbreak in Hubei province before lifting its quarantine there, even though the count of new viruses was already quite low three weeks past the peak.
- Countries need more testing and tracing capabilities. Given the tricky nature of this disease – many people are asymptomatic and others have mild symptoms that could well be an ordinary cold or flu – it is not enough to drive the official case count down to zero. There will almost certainly be undiagnosed cases unless testing is ramped up massively and the quality of tracing the path of infection from person to person improves.
- International borders will likely have to be kept closed for an extended period of time to prevent the re-introduction of the disease, particularly from poorer countries that have not been able to make the same efforts.
- Hospital demand must first return back to more normal levels.
- It would certainly help if one or several therapeutics were developed to take the sting out of the virus. It would also be very useful to develop a test that can identify if someone has achieved immunity to the virus from a prior infection. Scientists are pushing hard on both of these fronts.
- An ideal scenario would see a vaccine developed, but it is hard to fathom politicians being willing to wait this long before re-starting their economies.
Let us furthermore recognize that it is quite unlikely that the quarantine will be lifted all at once. Instead, a phased re-opening of the economy is likely. One option is to allow the young and healthy to return to their normal lives, and keep the old and infirm protected. Those who had already recovered from the virus would also be eligible to re-activate. Another option is to incrementally broaden the definition of what constitutes an essential service, allowing ever-more types of workers to return. The most likely process will involve some combination of the two.
Refining the rate of rebound
In light of the above analysis, we have further refined our thinking about how the economic rebound will look once quarantining is over. Relative to the assumptions presented last week, we have modestly slowed the rate of the initial rebound.
Our forecasts also now assume that some economic slack will remain at the end of 2021 (see next chart). The medium depth/medium duration scenario ends 2021 with an output gap of roughly -2ppt.
U.S. GDP: medium depth/medium duration scenario
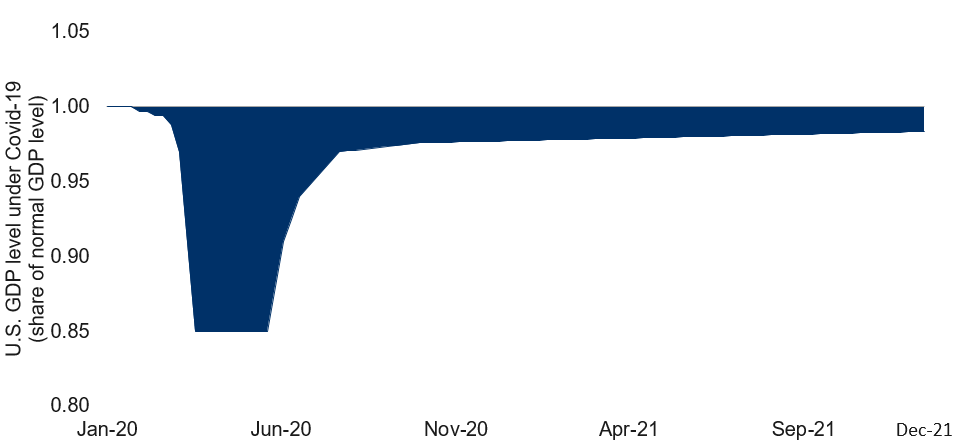
Note: As of 03/20/2020. RBC GAM estimates based on assumption of medium impact to economic activities in terms of duration and depth. Source: RBC GAM
The idea behind this newly lingering slack is that the developed world was in a fragile position before COVID-19 struck, emitting “late cycle” signals. Our thesis at the time was that a mid-sized shock could well nudge the economy into an organic recession. COVID-19 represents far more than a mid-sized shock, but its scale is sufficiently large that it is easy to forget that other dynamics are also at work, if less visible. In short, we assume that the economic hit is not entirely mechanical in nature, but also contains a smaller, more organic process of de-risking. In turn, it would be unusual for all economic slack to be eliminated within 18 months of such an event.
Altogether, these modifications slightly dim the 2020 scenarios relative to last week’s numbers, and moderately reduce the extent of any 2021 rebound (see table). But even with this diminished rebound in 2021, growth in the year is still expected to look truly remarkable as lost ground is recaptured. To the extent that the medium depth/medium duration scenario appears most likely, that aligns with U.S. GDP growth of -3.2% in 2020 and +5.6% in 2021.
COVID-19 scenarios: 2020 U.S. real GDP forecast
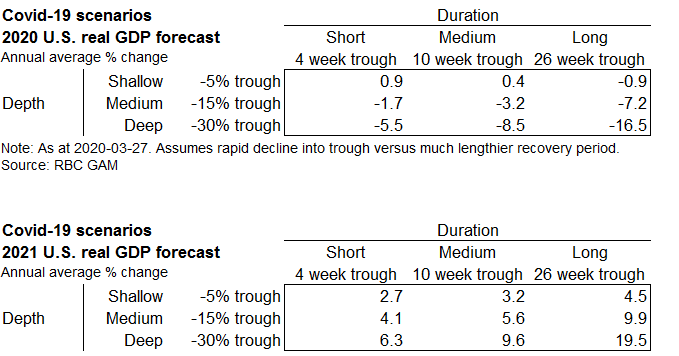
Note: As at 03/27/2020. Assumes rapid decline into trough versus much lengthier recovery period. Source: RBC GAM
International forecasts
How does COVID-19 affect other parts of the world? This depends on several factors, including:
- the extent to which nations have opted to quarantine, close borders and test for the virus
- the underlying quality of their health care system
- their emergency preparedness
- their demographics
- the structure of their economies.
The following figures focus on the medium depth/medium duration scenario presented earlier.
Within the developed world, the U.S. economy is forecast to shrink by less than the other developed economies in 2020 (by -3.2% versus approximately -4% in the other countries). In actual fact, we assume that COVID-19 will hurt the U.S. by more than most of the other countries, but this is more than offset by other challenges facing the remaining countries such as Brexit in the U.K., the oil shock in Canada, and Europe and Japan’s very low economic speed limit (see table).
Emerging market GDP growth (-1.4% in 2020) is moderately less negative than in developed countries (-3.7%), with global growth landing at -2.5% in this scenario.
Global growth forecast 2020: medium depth/medium length scenario
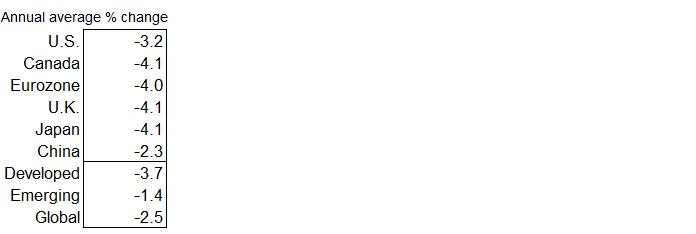
As at 03/27/2020. Source: RBC GAM
Versus the Great Depression
The COVID-19 shock bears more than a passing resemblance to the Great Depression given the sharp peak-to-trough economic decline of both events.
However, there are several important distinctions:
- The scale of the COVID-19 economic decline shouldn’t be quite as great. Our most likely scenario is for a 15% decline in output, whereas U.S. GDP during the Great Depression fell by 30% and industrial production declined by 47%.
- Crucially, the duration of the COVID-19 decline should be far, far shorter. We expect the virus-related trough to last anywhere from 4 to 26 weeks. In contrast, the Great Depression saw economic output declining for a stark four consecutive years. At worst, this is an episode that will be one-eighth as long, and it could well be a mere one-fiftieth as long. Indeed, the very definition of an economic depression relates mainly to its length, whereas this COVID-19 shock is notably for precisely the opposite quality.
- Among the many underlying differences between the two events, policymakers initially did very little to arrest the economic decline during the Great Depression, whereas heroic efforts are currently being taken.
Versus the global financial crisis
Superficially, at least, this COVID-19 shock actually looks deeper than the global financial crisis. The latter only saw a 4% decline in output from peak to trough, whereas we are today talking about scenarios involving a 5%, 15% or even 30% decline.
But, again, keep in mind that the duration of the trough matters enormously. While the global financial crisis was not as long as the Great Depression, it nevertheless took the better part of a decade for a normal level of output to be restored. This is unlikely with COVID-19 given the artificial nature of the shock.
We estimate that the total annualized economic output set to be lost from COVID-19 in the medium depth/medium duration scenario over 2020 and 2021 (see table – the 7.9% of GDP figure) should actually be about the same as the global financial crisis during its worst two years.
COVID-19 scenarios: cumulative forgone U.S. output
Note: As at 03/27/2020. The cumulative difference between actual and potential output over 2020 and 2021. Source: RBC GAM
Arguably more importantly, if we compare the two over a five year period, our best estimate is that the COVID-19 shock will ultimately do about half as much damage as the 19.2% of a year’s GDP that was forgone by the financial crisis.
Furthermore, the global financial crisis was primarily a financial event that then went on to hurt the economy. In contrast, COVID-19 is more of an economic event that is impacting financial markets. The latter is preferable for investors.
Updating the monetary response
The sheer amount of monetary stimulus now being pushed into the system is truly extraordinary. This is true both in terms of magnitude and breadth. U.S. quantitative easing (QE) on an annualized basis is now an amazing seven times larger than was the equivalent annualized action during the 2009 crisis, tallying to over $1 trillion per month. This arguably makes up for the fact that central banks had less room to cut their policy rates due to the low starting point.
With regard to breadth, the Fed is now or will soon be involved in supporting not just Treasuries and mortgages as was the case a decade ago, but segments of the ETF market, municipal bonds, commercial paper, student loans, auto loans, credit card loans and even small business borrowing. This is dizzyingly aggressive.
In Canada, the Bank of Canada has now taken its policy rate all the way down to a record low of 0.25%, and has leapt into QE for the first time, buying $5 billion of government bonds per week. A host of other central banks have also pushed aggressively into this space.
More on fiscal response
The fiscal response is also huge. The U.S. has now put together a fiscal package worth more than $2 trillion. At 11% of GDP, this is in approximate alignment with the size of the fiscal effort during the global financial crisis. One underlying parameter is also strikingly similar: both programs dedicated around 40% of their largesse to loans and loan guarantees, versus around 60% to direct spending and tax cuts.
The main difference is that the prior package was in response to a financial crisis and so most of the loans were directed to financial institutions. This time it is a broader economic event and so the help has been spread more broadly, to households and a wide range of businesses to minimize the economic disruption.
The U.S. is hardly alone in delivering large-scale stimulus. The country-by-country efforts can be seen in the following table.
Global COVID-19 stimulus packages
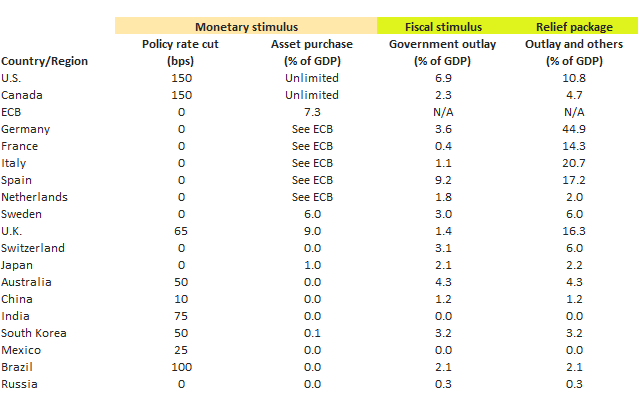
Note: As of 03/27/2020. No specific end date designated for Bank of Canada asset purchase program. New relief package that is still in the works included in estimates for Japan. Fiscal stimulus only includes spending and tax cuts by the government and does not include relief measures such as tax and fee deferral, loans and loan guarantees, and equity investment, etc. Source: National central banks, national government websites, ING, UBS, RBC GAM
Increasingly, countries are pivoting to encouraging companies to keep their workers on the payroll as opposed to laying them off, inducing this via large wage subsidies and loans that don’t need to be repaid if certain conditions are met. If successful, this will go a long way toward keeping the economic damage temporary.
The financial crisis also teaches us one more thing, which is that the fiscal stimulus often comes in multiple waves spanning more than a year. There is a strong chance that even more fiscal stimulus is coming. In turn, the fiscal response will likely end up being even larger than during the financial crisis.
Inflation implications
Thus far, we have talked exclusively about growth and not at all about inflation. A word here is appropriate on the second subject. In the end, inflation is likely to fall as a result of the hit to growth and oil prices. Our econometric models argue that:
- overall developed world inflation should go slightly negative on a year-over-year basis (due mainly to lower oil prices), and
- core inflation should tumble to the +0.5% to +1.0% range (due mainly to additional economic slack).
U.S. inflation expectations trending lower
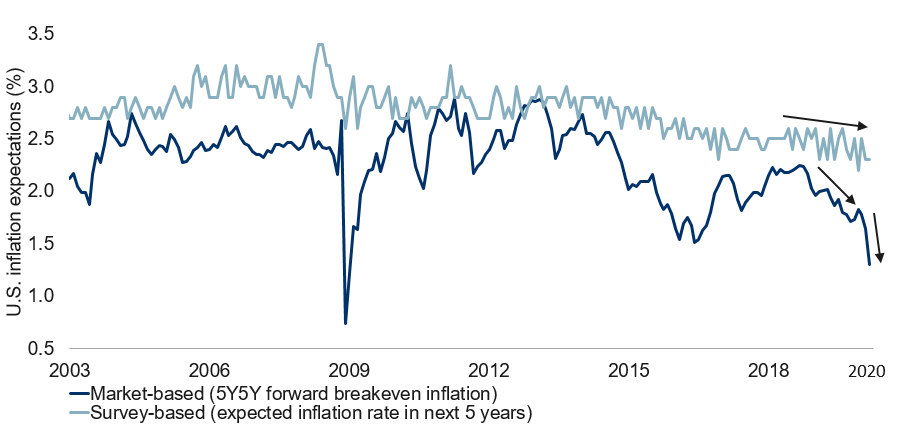
Note: Market-based inflation expectations as of 03/27/2020, survey-based inflation expectations as of Mar 2020. Source: Federal Reserve, University of Michigan Surveys of Consumers, Haver Analytics, RBC GAM
That said, it is a more complicated analysis than one might first imagine. Upward pressures on inflation include:
- quantitative easing
- supply chain issues
- a labour shortage, to the extent workers cannot go to their jobs.
In addition, a temporary shortage of essential goods like groceries should push their prices higher, whereas products for which there is a glut are not even being sold and so may not show up in some measures of inflation.
But the downward forces eventually win the day, including:
- massive opening of economic slack
- sharply lower oil prices
- lower inflation expectations
- lack of demand during the quarantine
- downward pressure from demographics.
Financial markets
As mentioned at the outset, financial markets have been steadier and less negative over the past week. One might argue that much as we have become more comfortable with our economic forecast, the financial market has become more comfortable wrapping its head around the issue as well.
It remains notable that the financial market reaction has been outsized relative to past major pandemics (next chart), though in fairness those pandemics did not trigger such aggressive quarantining.
COVID-19 market reaction exceeds prior pandemics
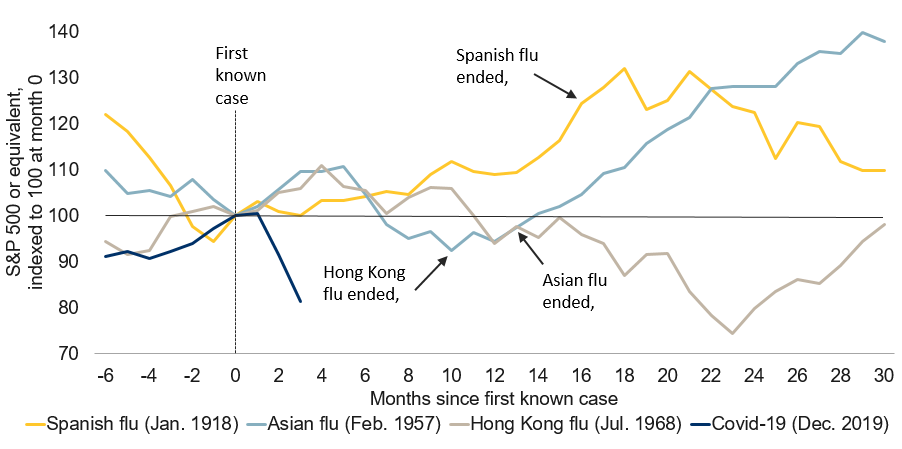
Note: As of March 2020. Source: Schiller, RBC GAM
We continue to track a variety of COVID-19-specific criteria to get a sense for how far through the crisis we are (see table). As it stands, three conditions have been at least partially met, while another eight have not. Markets are forward-looking and so are unlikely to require every box to be ticked.
Financial markets watching for key developments
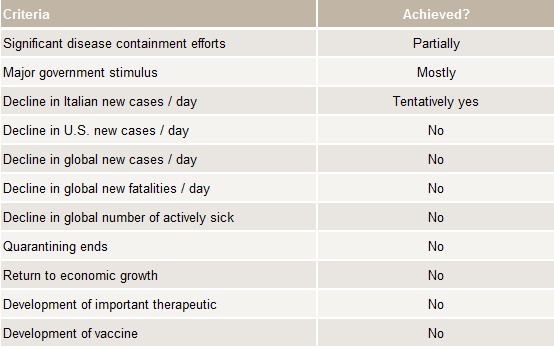
As of March 2020. Source: RBC GAM
Finally, from a long-term investment perspective, one can certainly make the case that risk assets are now cheap relative to historically normal valuations, while government bonds are expensive.
Long-term musings
Despite our expectation that the main economic thrust of COVID-19 will be brief and that the virus poses no serious threat to humankind in a larger sense, in what ways might it leave a lasting influence?
- Public debt levels will certainly be much higher than before, and corporate debt levels are likely to rise somewhat. It will take the former decades to work down, if at all. A rough calculation argues that the increase in public debt could reduce the sustainable rate of global growth by something like 0.25% per year – a significant toll to the extent it is levied indefinitely.
- By extension, interest rates will have to remain ultra-low for even longer than before to keep all of this debt affordable. Related to this, the divide between monetary and fiscal policy becomes every blurrier.
- Does extensive monetary stimulus and an increasingly hazy distinction between monetary and fiscal policy raise the risk of additional inflation? Yes it does, but it still isn’t our base-case forecast to the extent there appear to be powerful depressants at work as well.
- Globalization has taken another hit, and at a particularly bad moment to the extent that tariffs were already being levied. The flow of people is set to be significantly impeded, while the flow of trade should slow more modestly. Structurally, companies and governments may place a higher priority on diversifying their supply chains and on-shoring to ensure adequate domestic supplies during future crises.
- Does populism go up or down? One could certainly argue it goes up to the extent crises tend to create demand for miracle policy cures. Equally, however, COVID-19 is likely to be solved by scientists and experts, whereas populist leaders risk mishandling the situation. It is simply unclear for the moment.
- People and politicians are clearly putting a higher value on a human life than in the past. Prior pandemics never elicited a quarantining response of this magnitude, even when they were arguably more deadly, such as the Spanish Flu. This may be due to the fact that developed-world nations are no longer accustomed to the random loss of life associated with previously common illnesses like malaria, measles, the mumps, rubella and polio.
- Policymakers may prove willing to spend more in the future to mitigate low likelihood/high impact shocks such as pandemics and asteroids. This is a promising thought, as such risks are no less significant.
Lastly, we can speculate about the subtle ways day-to-day life might permanently change. Perhaps there will be less business and personal travel, more video conferencing and working from home, less handshaking, less materialism, more focus on family and a greater focus on the elderly. There could even be big innovations in previously stagnant fields such as teaching. Then again, 9/11 was supposed to make people unwilling to work in tall buildings or ride in airplanes, and demand for both revived with time.
-With contributions from Vivien Lee and Graeme Saunders