In my opinion, the holiday season is the best time of year for getting work done, but also for recharging from said work. There’s nothing like a deserted office, a slumbering inbox and an empty calendar to catalyze remarkable feats of productivity, particularly on long-deferred projects. Conversely, those very same attributes mean that – for once – the work doesn’t stack up while on vacation. Alas, both options cannot be pursued at the same time. I opted for the latter this year, and don’t regret it one bit. My lengthy to-do list, on the other hand, begs to differ.
Although the break is theoretically a low-key affair, my family of four somehow squeezes three birthdays into the week bracketing Christmas. As you can well imagine, this ratchets the materialism of the holiday season to frightening heights, and helps to explain how a set of weights found its way into our basement. Incidentally, I now know what a rotator cuff is – and also how to injure it!
Webcast:
- Tune in to our latest monthly economic webcast: A Happy New Year.
The decade ahead:
- It is hard enough to predict what the New Year may bring, let alone the next decade.
- In early 2010, the consensus outlook for the decade that has now just ended was far from perfect. It called for too much inflation (due to all that money printing), better economic growth (whereas chronically weak productivity growth has undermined growth) and for interest rates that would be low, but hardly this low for this long. Populism was absolutely a talking point, though much of it arrived later than was expected and manifested in a right-leaning configuration as opposed to a left-leaning variety. Fascinatingly, and illustrating the limitations of the economist’s core skillset, the slow economic growth of the past decade hardly held the stock market back. Part of this equity outperformance was simply because valuations were initially cheap and subsequently normalized. But the main story was the extent to which rising profit margins allowed corporate profit growth to massively outperform the underlying revenue growth.
- Given these various missteps, any outlook for the coming decade must be taken with a boulder-sized grain of salt. Still, it is useful to at least make an effort to predict the 2020s:
- Inflation seems likely to remain tame, and conceivably to soften further as a mild strain of “Japanification” infects Europe and to a lesser extent North America.
- Interest rates should remain quite low, though we’d like to believe the scourge of negative yields could diminish with time as the associated drawbacks and distortions become more visible.
- Populism has not yet obviously peaked, motivated as it is not just by the global financial crisis of a decade ago, but also by unresolved inequality and by a (partially internet-induced) fragmentation of societies.
- GDP growth is likely to remain sluggish, though we believe there may be some scope for an improvement in productivity growth, in part as exciting new technologies are unveiled, in part as statisticians get better at capturing recent technological developments, and in part as 1.4 billion Chinese join the developed world in pushing the global knowledge frontier forward.
- For its part, China is likely to become ever-more relevant on the world stage, already constituting roughly a third of global growth. Frictions with the U.S. are likely to persist, though fall short of war.
- Profit margins – the underappreciated secret to the financial market success of the past decade – seem less likely to continue pushing significantly forward over the coming decade, limited as they may be by greater regulatory oversight, anti-trust pressures and efforts to revive wage growth.
- The fact that many of the anticipated themes for the coming decade constitute re-heated versions of the themes that dominated the past decade means either that the world is not set to change very much or instead represents a failure of imagination on our part. Time will tell!
The latest wobble:
- For the past few months, we have trumpeted the idea that global economic growth is probably bottoming.
- Admittedly, the December U.S. ISM Manufacturing Index did not support this thesis. It fell from an already-weak 48.1 to a grim 47.2. Furthermore, the closely watched new orders and employment subcomponents also declined. All three metrics are now at or in the realm of their weakest reading since the financial crisis.
- Furthermore, the latest Chinese, U.K., German and Canadian Purchasing Manager Indices (PMIs) for December also declined.
- Fortunately, not everything is grim.
- First, one month does not a trend make. The global PMI was on a virtually uninterrupted run downward for two years, whereas it is now skittering upwards and downwards from one month to the next, but broadly going sideways. This is the central element of the “growth is bottoming” narrative, and the latest numbers don’t break this channel.
- Within the U.S., a variety of other leading indicators and economic metrics argue that all is still reasonably well. For instance:
- The Markit Composite PMI for the U.S. actually rose in December.
- The qualitative Beige Book has made an incremental improvement.
- The Chicago Fed National Activity Index staged a handsome gain in the latest month.
- Jobless claims recently fell back to an extremely low level.
- The latest month of job creation was surprisingly strong.
- Business hiring and employment intentions have improved (see first chart).
- Homebuilders are the most optimistic they have been in more than 20 years (see second chart). On this last item, recessions rarely occur without a problematic housing sector.
-
U.S. businesses hiring and capex intentions bounced back
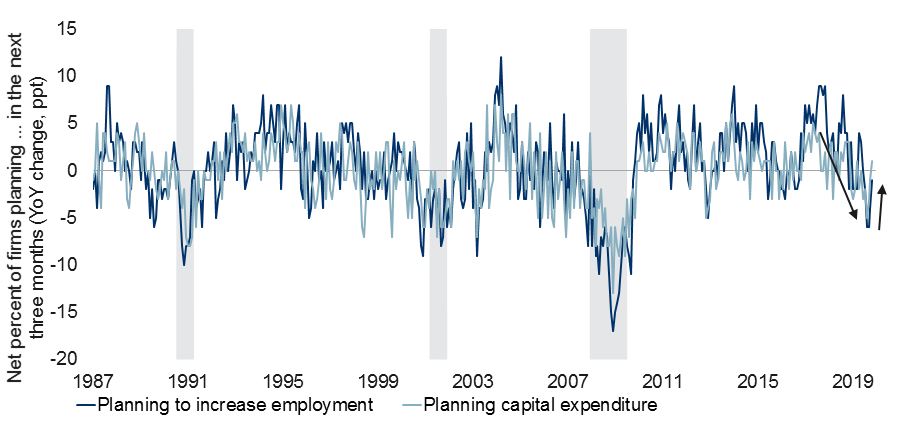
Note: As of Nov 2019. Shaded area represents recession. Source: NFIB Small Business Economic Survey, Macrobond, RBC GAM
-
Home builders most optimistic since 1999
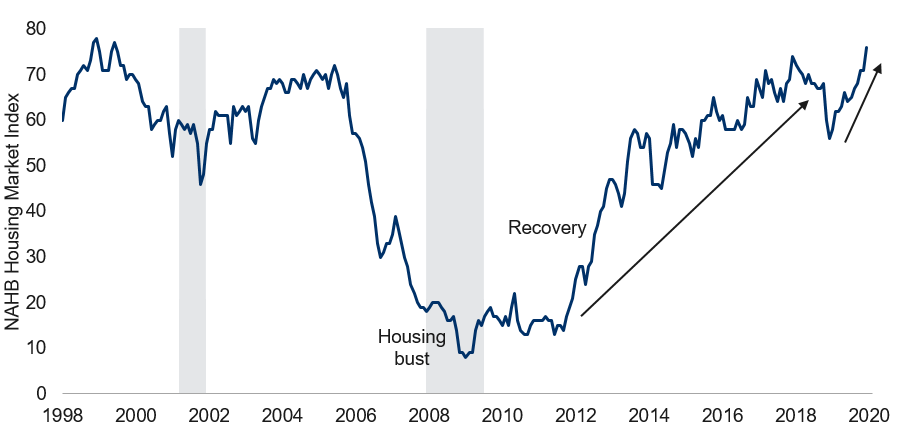
Note: As of Dec 2019. Shaded area represents recession. Source: National Association of Home Builders, Haver Analytics, RBC GAM
- Turning to the rest of the world, the consensus 2020 growth forecast for major developed markets was upgraded notably in December, with 7 of 13 countries enjoying upgrades versus just one downgrade. For context, the prior 14 consecutive months had witnessed more downgrades than upgrades to developed-market growth forecasts, with most months skewed heavily downwards.
- As such, while we don’t love the smattering of negative signals emerging from certain December PMIs, it still seems entirely credible to claim that the broader economic environment is getting slightly better as opposed to slightly worse.
U.S. political update:
- The U.S. presidential election will happen later this year and the first Democratic primaries will be staged in under a month (Feb 3 in Iowa, then Feb 11 in New Hampshire). As such, an update is in order.
- The Democratic field is beginning to winnow, with a further paring likely over the coming two months. The field is already down from north of 20 to 14. And if history is any guide, it could be down to as little as 3 to 5 candidates within the next two months. Indeed, no nominee in the modern era has ever placed worse than second in the New Hampshire primary.
- Betting markets currently assign the following probabilities to the various Democratic candidates (see chart).
-
Who will win the Democratic presidental nomination?
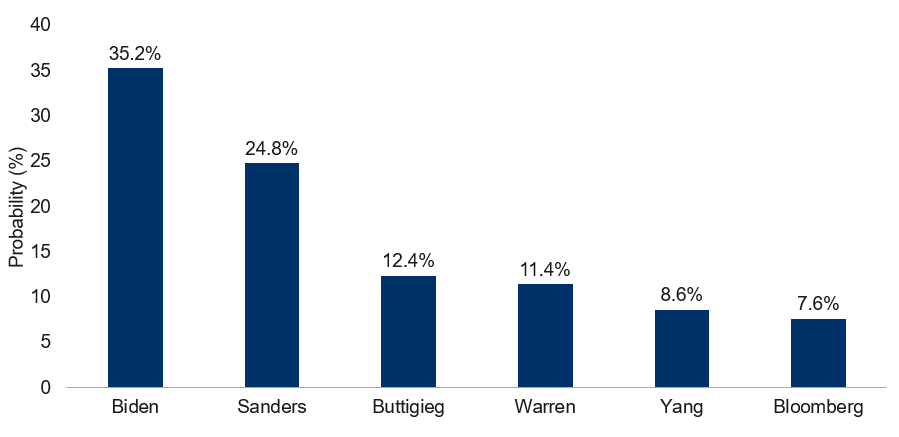
Note: As of 12/30/2019. Source: Predict, RBC GAM
- Joe Biden is top of the list, with Bernie Sanders some distance behind. After that, it is a close two-way race between Pete Buttigieg and Elizabeth Warren. Then there is Andrew Yang and ex-NYC major Michael Bloomberg.
- Note that these figures are distinct from polling results, instead representing whom bettors believe will ultimately prevail once all of the primaries are done. Thus, for instance, whereas Pete Buttigieg has recently soared in the polls and has a fighting chance of capturing some of the early nominations, markets are skeptical he can maintain his appeal in more diverse states. Conversely, the assigned likelihood of a Bloomberg nomination is higher than his polling, presumably because of his immense personal wealth and a strategy of blanketing the airwaves with costly ads.
- It is also notable that Elizabeth Warren, until recently the darling of the polls and betting markets, has faded all the way to fourth position. Conversely, Sanders is holding on despite earlier health issues.
- Another way of slicing this data is to break the nominees into centrist, left and far-left categories. The centrists (Biden and Bloomberg) have a collective 43% chance of capturing the nomination; the left candidates (Buttigieg and Yang) have a 21% chance; and the far-left candidates (Sanders and Warren) have a 36% chance. Thus, the centrist and far-left candidates are collectively fairly close, though it is interesting that the centrists are now slightly ahead. This was not the case last fall.
- Meanwhile, despite his recent impeachment by the House of Representatives, President Trump is the prohibitive favorite to be the Republican nominee for the election. Betting markets currently assign close to 50-50 odds of a Republican (presumably Trump) capturing the White House, though conceivably this will change depending on who the Democratic nominee is. We suspect a centrist would stand a better chance than a left or far-left nominee, but the analysis is murky, coming down to the eternal debate between capturing independents and energizing the party’s base. Head-to-head polls are mixed on this, arguing that centrist Biden has the best chance against Trump, but he is followed closely by the far left’s Sanders.
- For the moment, financial markets prefer the Trump they know (with his history of tax cuts) to the Democrats they don’t know, particularly those expressing an antagonism toward large businesses.
Canada’s inverted yield curve:
- For all of the celebration about the recent re-normalization of the U.S. 3-month to 10-year yield curve and the diminished recession risk it implies, some other countries maintain inverted yield curves. Canada is a prominent example, with a 3m-10yr spread of -7bps.
- Does Canada’s inverted curve imply that the country has a greater risk of recession than the U.S.? We are torn on this subject in that we do believe Canada may be hit harder than the U.S. whenever the next recession does alight. However, this conviction is not to the point that we expect a Canadian recession absent a U.S. one. Really the only scenario in which Canada succumbs without the U.S. is in the event of plummeting oil prices. That risk doesn’t seem any larger than usual at present.
- How, then, to reconcile Canada’s inverted yield curve?
- Canada’s 3m-10yr curve has not been as prescient as the U.S. equivalent in predicting domestic recessions. The last six Canadian inversions have only yielded two Canadian recessions (see next chart). The U.S. hit rate, while also imperfect, has a 75% hit rate over the same time period.
-
Canada 3m-10yr spread inverted since May 2019
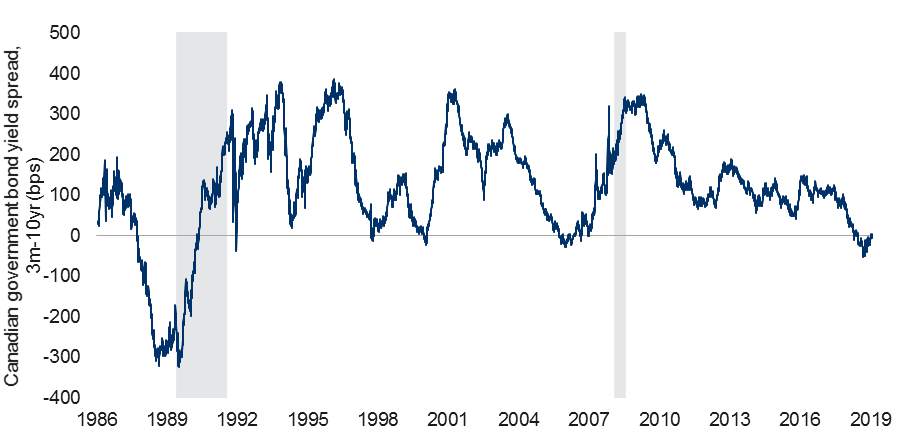
Note: As of 12/31/2019. Shaded area represents Canada recession. Source: Macrobond, Haver, RBC GAM
- Canada’s curve is arguably distorted by the fact that – unlike in the U.S. and many other countries – the national central bank has opted not to cut the policy rate. Thus, whereas Canada’s long end moved in approximate lockstep downward with the global trend over the past 15 months, the short end has been unable to keep pace to the same extent as in other markets. This has created an accidental inversion.
- Canada’s curve is normally flatter than the U.S., by an average of 37bps for the 3m-10yr spread since 1990. If one assumes that the recession risk of the two countries is roughly equivalent over the long run, and simultaneously that 0bps is the relevant recession-predicting threshold for the U.S., Canada’s curve would need to be inverted by 37bps to generate the same signal. But the current curve is not so inverted. Helping to explain Canada’s historically flatter curve, liability-driven investing has historically been a popular approach for pension funds in Canada, creating a super-charged appetite for long-dated Canadian bonds.
- That said, if the current trend persists, all of this analysis could soon prove moot. Canada’s yield curve is steepening much like the U.S., having progressed from -53bps last August to just -7bps today. Whatever the Canadian recession risk is, it has diminished over the past several months.
Data nuggets:
- Impeachment: The U.S House of Representatives impeached President Trump on December 18, as anticipated. The House then left Trump dangling over the holiday break as it delayed handing the case over to the Senate. Whenever the trial occurs, it is highly unlikely to result in the removal of the president from office.
- S.-Iran relations have been our number one geopolitical risk for the past several quarters, but relations deteriorated further over the past week after the U.S. killed a prominent Iranian military figure in the aftermath of an attack on the U.S. embassy in Baghdad. While the risk has clearly increased of a significant confrontation, and accordingly the risk premium now embedded in the price of oil seems justified, our base case remains that the situation does not deteriorate too drastically. From the U.S. perspective, Trump is fundamentally an isolationist, Iran would be a formidable opponent, high oil prices would hurt American consumers, and war-fatigued American voters probably wouldn’t reward a bellicose president to the extent they have in the past. For its part, Iranian leadership would ultimately lose a war and possible control of the country. Thus, the stalemate will likely persist.
- Japanese retail sales rebounded by 4.5% in November after plummeting by 14.2% in October. The decline had been in response to the country’s sales tax hike on October 1st. Factoring in a pre-hike sales surge, retail sales are now just 2% below the prior norm. This is better than the 3% undershoot that occurred after the prior sales tax hike in 2014.
- The U.S.-China Phase One trade deal is set to be signed by President Trump on January 15. We reiterate that the deal is a useful step forward, but it merely reduces the effective tariff rate in the U.S. from 4.6% to 4.2%. Substantial tariffs remain.
- World Trade Organization (WTO) dysfunction: While we celebrate the incremental improvement in U.S.-China relations, let us not pretend that all is back to normal on the trade front. Many examples could be proffered, but a fascinating (and long-dreaded) development is that the WTO appellate body has now ceased to operate. The body hears countries’ appeals against dispute-resolution recommendations issued by WTO panels. The group is central to the process of dispute resolution, as 67% of the WTO’s recommendations are challenged. However, the U.S. has a veto on appointments to the body, and has been blocking all efforts to appoint new members as terms expire. In turn, the number of members has dwindled from seven to below the minimum threshold of three as of December 10, 2019. In turn, the WTO is now fundamentally broken as a means of resolving disputes between WTO members. The present U.S. administration has long sought to refashion the way that global trade is adjudicated. Whether this pressure point succeeds in bringing other countries to the table to re-negotiate the entire system of resolving trade disputes is not yet clear. At a minimum, it seems unlikely that the U.S. will be given a veto in any future system.
- S. employment preview: After a blockbuster gain of 254K U.S. jobs in November, the consensus anticipates the addition of a more sedate 153K jobs in December. Let the record show that 153K is still a perfectly good result, and would be consistent with the continuation of the economic expansion. We continue to be on watch for sub-100K reports, which would begin to hint of trouble for consumers and eventually the economy.
- In Canada, all bets are off after a startling -71K job performance in November. It is unlikely that such an outcome will be repeated and we are dubious that Canada is actively shedding jobs on a trend basis. But the prior month helps to reconcile what had been weirdly fast job creation versus more sluggish economic gains. Going forward, we look for an average of 10K-20K new jobs per month.