I’ve just returned from what has become a January tradition – a whistle-stop tour of Europe that somehow manages to cram six countries’ worth of client meetings into a mere five days. Last Tuesday was particularly notable, beginning with breakfast in Milan, transitioning to lunch in Zurich and finishing with dinner in Stockholm. While this sounds rather exotic, the reality is that I see virtually nothing of each place. On the positive side, the temperature was never colder than 8 degrees – you won’t hear me complain about that in January!
Having barely settled into my chair, I am now about to head back out the door for a week in Western Canada. Providing further evidence that I live a blessed existence when it comes to the weather, the temperature in soon-to-be-visited Calgary and Edmonton is in the process of pivoting from -40 to 0 degrees Celsius! I’ve made sure to pack my shorts.
A drag from higher yields and oil?
- Bond yields and the price of oil have both increased palpably since early October. The U.S. 10-year yield has risen by 30bps to 1.82% as economic growth stabilized. The price of WTI (West Texas Intermediate) oil has increased by US$6 to $58 (having traded as high as $63 on Iranian concerns).
- Higher interest rates and higher oil prices are usually bad for global economic growth.
- The obvious question, then, is whether these recent adverse developments necessitate a significant downgrade in the growth outlook.
- The short answer is “no.” There are several reasons why:
- Keep in mind that some fraction of these market movements are in direct response to better economic growth prospects. As such, it would be unusual if the market response was so forceful that it completely undermined the very development that was being celebrated.
- Financial conditions indices – usually relied upon to map financial market developments onto economic implications – have not actually deteriorated (see first chart). What appears to be happening here is that the drag from higher interest rates is being more than offset by narrowing credit spreads and rising stock markets. Oil prices are not directly factored into most financial conditions indices, so one can argue that financial conditions may not actually be improving as much as they appear to be, but even with oil prices considered, they probably aren’t deteriorating significantly. Classic OECD models argue that a roughly 10% increase in oil prices would subtract no more than 0.1ppt from the growth rate of even the most adversely affected major markets.
- The precise economic implications of higher oil prices, in particular, depend on the country in question. Net importers such as Japan and the Eurozone are hurt, while net exporters such as OPEC nations and Canada are actually helped. Landing somewhere in the middle is the U.S., which has arguably shifted from the net negative bucket into a more neutral stance as its own energy sector has blossomed over the past decade.
-
Global financial conditions eased
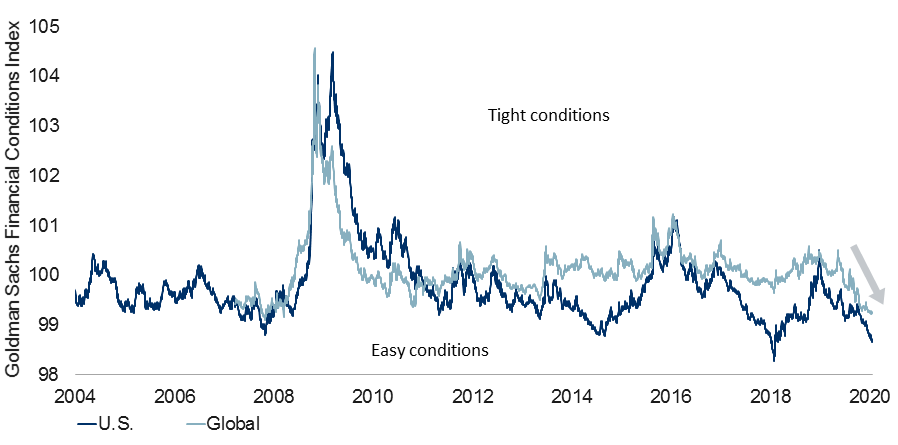
Note: As of 1/16/2020. Source: Goldman Sachs, Bloomberg, RBC GAM
- Incorporating this information into some preliminary thoughts on the prospective relative performance of global growth over the first half versus the second half of 2020, we look for the former to modestly outperform the latter.
- Financial conditions are set to become less supportive for the second half of the year. This is not so much a forecast as an acknowledgement of the lags involved and the fact that 2019 rate-cutting translates into a big growth boost in early 2020. However, the effect fades by the second half of the year.
- Granted, a similar set of lags means that protectionism should exert a bigger drag over the first half of 2020 than the second half, but the monetary stimulus support should prove the more dominant consideration.
- In light of what could be slightly decelerating growth into the second half of 2020, we continue to flag the possibility that central banks will opt to deliver more monetary stimulus, and also that more fiscal stimulus is reasonably likely to be delivered.
Europe’s relative resilience?
- Having just returned from a European business trip, the continent is quite naturally on the mind.
- One popular debate is the extent to which Europe might prove more economically resilient than the U.S. over the coming years. We are dubious, but the arguments in favour of this proposition are not completely ridiculous:
- Whereas the U.S. appears to be at a late point in its business cycle, the Eurozone may not be quite so far along. One can construct a mid-cycle argument for Europe given the fact that the region’s expansion has only lasted for seven rather than the 10 years of the U.S. Also, the Eurozone output gap hasn’t yet fully closed, whereas the U.S. is already in a position of excess demand.
- The Eurozone also enjoys considerably more spare fiscal capacity than the U.S. While the U.S. structural fiscal deficit is a massive 6% of GDP, the Eurozone’s current deficit is less than 1%. In theory, then, the Eurozone could put together a gargantuan fiscal stimulus package worth up to 5% of GDP (nearly US$700B!) without deteriorating below the pre-existing U.S. fiscal position. Furthermore, Eurozone public debt levels are, on the aggregate, lower and its borrowing costs are cheaper than the U.S., making this form of stimulus unusually affordable.
- Although there may be less room for additional monetary stimulus in the Eurozone relative to the U.S., the ECB (European Central Bank) is not completely out of tricks. It could go so far as to print money and buy any number of non-bond assets if it were truly inclined. Japan and Hong Kong have both experimented with this in the past, purchasing equities. While this solution doesn’t further reduce borrowing costs, it does boost risk appetite in a valuable way. Furthermore, even if the ECB were completely out of room for stimulus of its own, rate cuts delivered in other major markets should bleed partially through to the Eurozone (with a fraction of the benefit refunded via a stronger euro, admittedly).
- The problem with the view that the Eurozone could have years of additional growth ahead of it, above and beyond that of the U.S., is that the Eurozone is arguably more vulnerable in other ways:
- Although Europe is plausibly less far along in its business cycle than the U.S., the interconnectedness of economies along trade, financial market and confidence channels (as evidenced by the recent synchronization of global growth) is such that it is naïve to think that the Eurozone could continue sailing along even as the U.S. or others encountered heavy seas. Furthermore, to the extent that the Eurozone’s natural economic growth rate appears to be considerably slower than the U.S., a moderately-sized negative shock could well have the effect of sending the Eurozone into technical recession even as the U.S. continues to eke out growth.
- As alluded to earlier, the U.S. has more room in which to deliver traditional monetary stimulus, either via traditional rate cuts or buying government bonds.
- While the Eurozone may well have additional fiscal space from a deficit and debt perspective, its strict fiscal rules, traditional northern European fiscal conservatism and the challenge of coordinating across 19 Eurozone nations means that a large dose of fiscal stimulus would be anything but assured out of Europe, even in the event of a crisis.
- The Eurozone is arguably more vulnerable to certain geopolitical risks than is the U.S. by virtue of the former’s status as a net importer of energy. A significant oil price shock could plunge the Eurozone into recession while leaving the U.S. woozy but still standing.
- Finally, European banks are still – on the whole – weaker than their U.S. brethren, with the implication that any financial crisis might be transmitted more readily through Europe.
- On the whole, then, the Eurozone may well have more theoretical room until its next recession by virtue of being earlier in the business cycle, but it also has plenty of fragilities that could yet get in the way.
- While it probably isn’t realistic to look for the Eurozone as a place of refuge whenever the next U.S. or global recession comes along, it must be remarked that the region nevertheless has several alluring qualities for equity investors so long as this global expansion continues:
- Its dividends are unusually attractive.
- Its equity valuations are presently depressed.
- We look for a stronger euro over the coming year.
- The region’s economic growth appears to be successfully stabilizing.
Sources of equity gains:
- As economists, we like to flatter ourselves by thinking that economic analysis provides at least some small insight into the future trajectory for equity markets. The most obvious connection is that businesses earn their revenues from the economy, and so economic growth is theoretically a predictor of revenue growth. In turn, revenue growth is usually a central determinant of stock market gains.
- However, the connection between the U.S. economy and U.S. equities has been unusually tepid over the past dozen years. From Q3 2007 to Q3 2019, revenue growth drove less than one-fifth of the stock market’s 152% total return over the period (see next chart).
-
Contribution to S&P 500 Index total return (from Sept 30, 2007 to Sep 30, 2019)
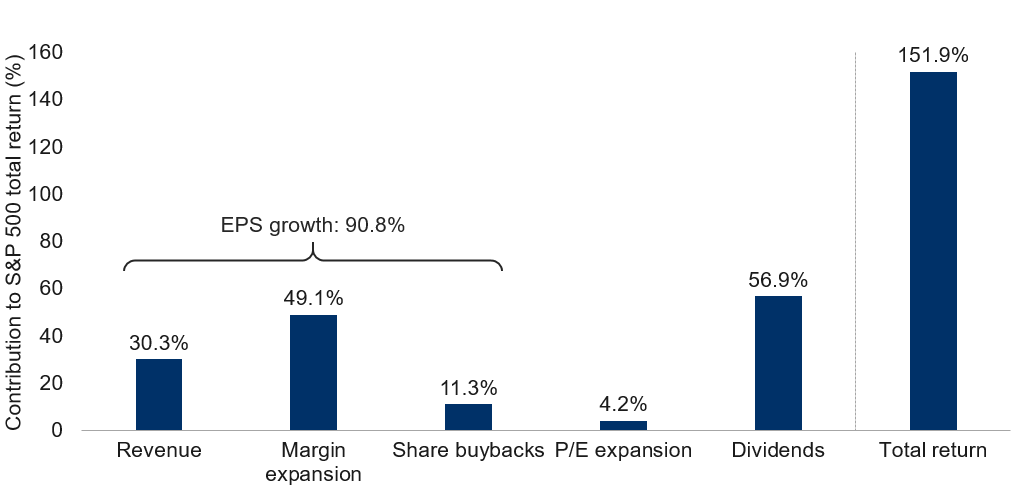
Note: As of Q3 2019. Source: Bloomberg, Haver Analytics, RBC CM, RBC GAM
- How did equities generate such a large return across periods of tepid economic growth, and what explains the other four-fifths of the return?
- First, dividends contributed 57ppt. There is nothing particularly shocking here – while this constitutes a generous contribution, it is not wildly out of line with what one might expect on a steady-state basis over 12 years.
- Second, share buybacks contributed another 11ppt. This cannot be said to be a normal contribution. Buybacks are a relatively recent factor – similar in concept to dividends, only more tax efficient and particularly popular when borrowing costs are low and stock valuations are cheap (as was the case for much of the past 12 years).
- Third, P/E (price-to-earnings) ratio expansion also contributed to the total stock market return. This is a variable that should subtract from returns roughly as often as it helps them, meaning that the past 12 years were somewhat fortunate in this regard. If anything, it is surprising that the contribution was only 4ppt given how substantially P/E multiples have expanded since the financial crisis. But keep in mind that this analysis intentionally begins before the financial crisis – in the fall of 2007 rather than the spring of 2009 – so as to avoid needlessly juicing the contribution from P/E ratios given that they had fallen by a similar amount immediately beforehand.
- We save the most interesting contribution for last. Profit margin expansion drove a big 49 percentage points of the total stock market return over the past dozen years. This has been the truly exceptional development. Traditionally, profit margins have been viewed as a mean-reverting variable, inclined to fall back after a period of strength, and vice-versa. However, it is increasingly difficult to conclude that profit margins are mean-reverting. They are seemingly on a structurally rising trend that has now spanned several cycles. Supports have included rising firm concentration with sectors, declining unionization, cheap borrowing costs, globalization and extreme economies of scale in the internet age.
- Turning from this accounting of past glories and toward an outlook for the future, one can likely rely on a moderate contribution from revenue growth and a fairly familiar contribution from dividends (with a dash of equity buybacks). But will profit margins again hit a home run, and might equity valuations also continue to make a modestly positive contribution?
- On profit margins, much depends on how aggressively governments opt to litigate their anti-trust concerns against the world’s tech giants. This, alongside somewhat firmer wage growth and fading globalization should at a minimum slow the rate of ascent of profit margins, and could well halt them in their tracks. That said, we are dubious that profit margins need to retreat to levels that would have been deemed normal before the financial crisis.
- With regard to valuations, the prudent approach is to recognize that U.S. equities seem a bit expensive by conventional measures while several other markets appear somewhat cheap. In turn, valuation adjustments could slightly hinder the U.S. in the coming years while plausibly helping others. That said, one needs to leave open at least the possibility that in what appears to be a structurally low interest rate environment, the new normal stock market valuation should be considerably higher than the historical norm. That represents an important bull-case scenario for equities.
- In turn, while it probably isn’t prudent to assume that the coming dozen years will generate an equity return as generous as the last 12, there are still certainly avenues of support in place for the global stock market.
Quick items:
- The theme of “economic stabilization”: It still appears to be the case that economic growth is stabilizing after two years of deceleration. The latest anecdotal supports include a further modest improvement in the consensus global growth forecast, subtle improvements in the latest U.S. Beige Book report, and a suite of Chinese data discussed shortly.
- Impeachment update: After the U.S. House impeached President Trump in late 2019, House Speaker Pelosi initially delayed passing the case along to the Senate. However, the Senate has now received the case and hears opening arguments this week. The last such impeachment trial spanned five weeks. The outcome is nearly certain acquittal given the large Republican majority that commands the Senate.
- USMCA: The USMCA trade deal between the U.S., Mexico and Canada is continuing to inch forward more than a year after having been tentatively struck. After Mexico made concessions to the House of Representatives, both chambers of U.S. Congress have now passed the bill and it is awaiting Presidential approval. Mexico long ago ratified the trade agreement, though may need to introduce additional domestic legislation to enact certain labour law concessions it made to the U.S. For its part, Canada must still ratify the law in parliament. All of these should be fairly easily achieved. Over the near term, the new USMCA does not radically change the trade environment relative to the outgoing NAFTA.
- U.S.-China trade deal: The Phase One U.S.-China deal was signed as expected on January 15 and will be formally implemented 30 days later. The contours were broadly as expected, including:
- A slight reduction in the U.S. tariff rate on China
- China’s commitment to buy $200B in additional U.S. goods over two years
- A fairly significant strengthening of intellectual property laws by China
- A commitment by China to continue opening its financial services sector to foreign firms
- A dispute resolution mechanism.
- While this constitutes very good news, we are doubtful that a Phase Two deal can be reached and do not budget for a significant further reduction in U.S. tariffs from here.
- Chinese GDP landed at 6.1% YoY (year-over-year) for 2019, the weakest performance in nearly 30 years. But don’t let that statistic overly influence your interpretation of the result. It was, if anything, a bit better than expected and it is no surprise that an increasingly wealthy China isn’t growing as quickly as when its economy was much smaller and poorer. The monthly data that accompanied the quarterly update was actually fairly good, with significantly better-than-expected industrial production and slightly better-than-expected retail sales and fixed asset investment. We continue to flag China as an upside risk as the country’s government delivers stimulus of various forms.
- Chinese illness: Concern is mounting about a new coronavirus spreading from human to human in China. For the moment, little is known about how easily the virus can be transmitted or its fatality rate. Japan, the U.S. and Canada are now screening for the virus at border checkpoints.
- Gold’s rally: Gold has mounted an impressive rally over the past year and a half, rising from under US$1200 per ounce to more than $1500. Supports include low borrowing costs (making gold’s lack of a coupon or dividend less problematic), diminished interest in cryptocurrencies (a competitor for gold), the relatively full valuation of other asset classes (neither bonds nor equities are particularly cheap by historical standards), central bank gold purchases, and – looking forward – the prospect of dollar weakness over the coming year, the possibility that central banks will deliver additional monetary stimulus, and the reality of elevated geopolitical risk (particularly with regard to Iran and therefore the price of oil – a classic driver of inflation and consequently quite relevant for gold).
- Inaugural Canadian consumer survey: The Bank of Canada has published a brand new quarterly consumer survey. It reveals a mix of views. Canadian consumers are generally optimistic, expecting faster home price appreciation. They claim a willingness to quit their jobs (usually a sign that the labour market is strong). And, they are planning for their spending to outgrow their income. This last factor is a short-term support for growth, but is concerning over the medium run and beyond. Providing a more sober view, the survey also revealed that Canadians have rising job loss expectations. The long-standing Business Outlook Survey was mixed, revealing no overarching shift in Canadian business conditions.