Monthly economic webcast:
- Our latest monthly economic webcast is titled “Rebounding markets / slowing growth”.
Personally Invested podcast:
- Adding to the bounty of your audio-visual entertainment this week, here is an Economic Outlook podcast I recently recorded with host Dave Richardson.
A slew of good news:
- In sharp contrast to our usual (and soon to be resumed!) tendency of discussing the slowing global economy and the various forces contributing to that dour trend, let us acknowledge the welcome burst of positive news that has recently bubbled to the surface.
- Risk assets:
- The S&P 500 just managed its best January in more than 30 years, reclaiming a big 7.9% of previously lost ground. Similarly, credit spreads have narrowed. This is clearly good news, and reflects some of the other positive news discussed shortly.
- However, this market performance can hardly be viewed in isolation. It comes on the heels of a hellish December that represented the worst December outcome for the S&P 500 performance in a remarkable 88 years. Overall, stock markets are still well down from their 2018 highs.
- U.S. payrolls:
- U.S. job creation was a closely-watched affair in January, ultimately yielding a barn-burner of a report: 304K net new American jobs. This was nearly double the expected rate, and roughly triple the rate necessary to maintain a steady employment rate over the long run. It also represented the 100th consecutive month of job gains – a new record.
- We already knew that the U.S. government shutdown wouldn’t directly undermine the job figures. But there was the possibility that the shutdown would spook companies into scaling back their hiring plans. Similarly, financial market volatility could have iced hiring activity. Fortunately, neither of these fears were realized in the data – it appears the U.S. economy continues to chug along, at least for the moment.
- One counter-trend was the weakness of unemployment-related figures. The headline unemployment rate edged up from 3.9% to 4.0%. This was a small move, but it builds upon an earlier increase from 3.8% to 3.9% (and the knowledge that once the 3-month moving average of the unemployment rate has risen by 0.4ppt or more, a recession follows more often than not). The broader U-6 measure jumped up from 7.6% to 8.1%. And the latest weekly jobless claims hopped from the lowest reading of the post-crisis era (200K) to the highest reading since 2017 (253K). Does this suggest trouble brewing? Not obviously: the unemployment rates rose mainly on greater labour force participation rather than a dearth of jobs. The jobless claims spike appears temporary, possibly related to a second-order effect from the government shutdown, weather effects, Martin Luther King Jr. Day gremlins and a California teacher strike.
- The important ISM Manufacturing index bounced significantly higher in January, leaping from 54.3 to 56.6. This doesn’t completely undo the precipitous drop recorded in December. But it avoids what many (including ourselves) had feared would be a further decline as business leaders retrenched. In turn, it would appear that not only are U.S. businesses still happy to hire, but they are also content to invest in capital. The much-feared confidence shock is not readily apparent in any of this data. Consistent with this, the key anecdote trickling back from Davos is that business leaders were less worried than expected.
- China’s latest round of PMI readings yielded some pleasant surprises. The government’s official manufacturing PMI inched higher from 49.4 to 49.5. The non-manufacturing version rose from 53.8 to 54.7. Given all of the sour talk about Chinese growth, this was welcome news. On the other hand, the privately-generated alternative to these measures – the Caixin PMIs – both fell. The manufacturing version declined from 49.7 to 48.3 and the service measure from 53.9 to 53.6. Which to trust more? Both arguably deserve some attention, though the latter may merit a greater weight given suspicions that the Chinese government smooths the economic data it reports.
- From a corporate perspective, Boeing made unexpectedly favorable comments about demand for airplanes – a potentially important result given the extent to which the company is representative of both cap ex intentions and spending more generally. Of course, the corporate evidence doesn’t line up solely on the positive side of the ledger. Caterpillar earlier reported the opposite trend, and it is no less a bellwether.
- The Fed continued to pivot in a more dovish direction last week. It eliminated its forward guidance for additional rate increases in favor of a message of “patience” and (in the case of the central bank’s gradual balance-sheet rundown) greater sensitivity to economic conditions. The statement downgraded the growth assessment from “strong” to “solid.” It also characterized inflation pressures as “muted.” As a result, no near-term hiking seems likely. This is a big deal for markets, as concerns about rising rates were arguably half of the reason that the stock market suffered its late-2018 tumble (the other half was slowing growth).
- Lastly, financial conditions indices are no longer as tight as they once were. This is because central bank expectations have retreated, bond yields have fallen, credit spreads have narrowed and the stock market has partially recovered. In fact, the U.S. financial conditions index has now unwound fully half of the tightening that occurred since last fall, though it remains a long way from the extremely loose conditions that briefly prevailed a full year ago. One of the expected drags on 2019 growth has slightly diminished its grip.
- To recap, then, there has been quite a lot of good macro news over the past week, disproportionately of a U.S. origin. Let us also not forget the end of the U.S. government shutdown just over a week ago. The U.S. economy continues to defy the downward trend dominating elsewhere.
- We would be remiss not to mention the combination of protectionism, fading fiscal stimulus and tighter financial conditions that should eventually tame U.S. growth. But for now theory is being trumped by a happier reality.
European weakness:
- Whereas U.S. growth remains good, the Eurozone has clearly slowed. This contrast comes as somewhat of a surprise as the latter region is much less adversely affected by such frictions as protectionism and diminishing fiscal stimulus.
- Italy has just reported a second consecutive quarter of declining GDP – a convenient shorthand for a recession. This isn’t quite as bad as it sounds, as the economy merely shrank by 0.1% and then by 0.2% – hardly the stuff of disaster. And keep in mind that Italy is notorious for its meagre growth, with the economy still smaller than it was in 2004. Still, these were the first quarterly declines in half a decade. In part, they were likely the result of the country’s new populist government and the resultant increase in borrowing costs.
- More worryingly, German growth has also slowed markedly. Industrial production is now down on a year-over-year basis and the economy shrank in the third quarter. While an outright recession is unlikely, Europe’s growth engine is clearly sputtering. The good news is that Germany has enormous room for fiscal stimulus should it so desire. The bad news is that Germany may well not desire stimulus, given its history of fiscal conservatism.
- French yellow vest protests continue, interfering with economic activity and also eroding Macron’s pro-growth reform plans.
- Europe is still an interesting place given cheap stock valuations and a business cycle that seems less advanced than in the U.S. But for the moment, the growth trajectory is clearly inferior.
Money supply:
- We don’t tend to talk much about the money supply – a radical departure from what was a central topic of economic conversation in the 1970s and 1980s. Other economic variables have simply proven more useful over the intervening years.
- That said, money supply measures may be worth a moment of attention again, if only because so many countries are now experiencing the same decelerating trend in money supply growth (see next chart).
- However, divining the implication of this downward trend is more easily said than done. M2 growth – the money supply measure depicted in the chart – appears to lead and be positively correlated with GDP growth. As such, this is a negative economic signal.
- However, some analysts swear by the narrower M1 measure of the money supply. On the surface, this alternate measure is telling the same story: a decelerating trend. However, when we try to correlate M1 growth with GDP growth, we find that the relationship is actually inverted. Slower M1 growth implies faster GDP growth in the future.
- Thus, conflicting signals are emanating from the money supply, one arguing for slower growth, the other for faster growth. We can’t quite say that the two cancel each other out, but it helps to explain why money supply measures are no longer scrutinized quite as closely as in the past.
- In the end, we believe M2 growth deserves a slightly greater weight, meaning there probably is a decelerating economic signal embedded within the data. But note that even M2 has been far from failsafe as a signal. It did indeed predict the U.S. recession in the early 2000s. But it was accelerating into the 2008—2009 recession, thereby providing a false signal. And then all bets are off once a recession has actually begun: the money supply often surges due to central bank stimulus, rather than collapsing due to economic inactivity.
Global money supply growth has slowed
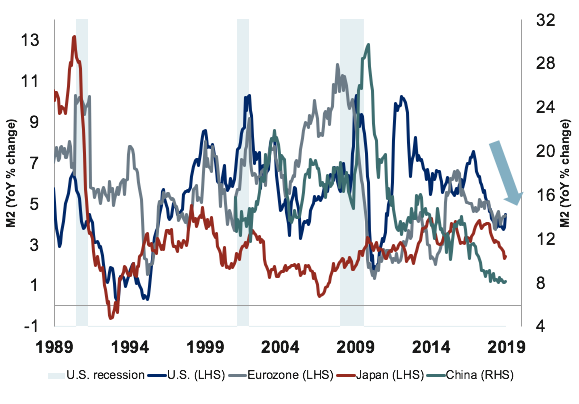
Note: As of Dec 2018. Source: Haver Analytics, RBC GAM
Revisiting deregulation:
- In assessing the magnitude and sign of U.S. fiscal forces on economic growth, we have tended to focus on the tailwind from tax cuts versus the headwind from tariffs.
- However, the White House’s deregulatory effort is also an important consideration. The next chart demonstrates, as per George Washington University calculations, that the Trump era has indeed delivered far fewer regulatory actions than the prior two presidents, by a factor of three or four to one.
-
Declining regulatory actions under Trump
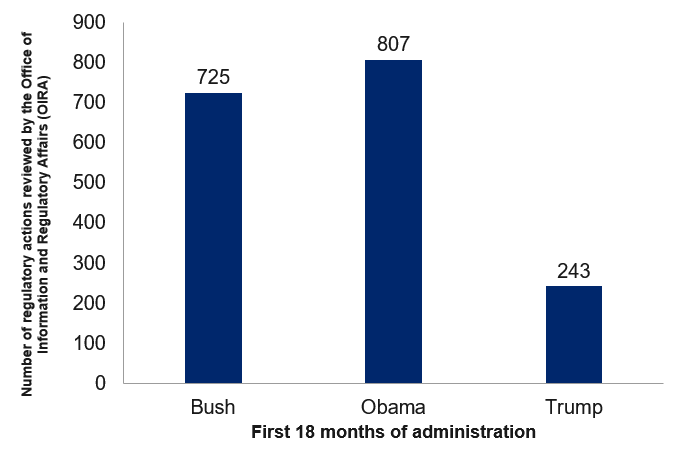
Note: As of 7/20/2018. Source: George Washington University Regulatory Studies Center, RBC GAM
- The final chart below notes that the greatest deregulatory thrust has occurred in the environmental and financial spaces. This squares with the view that President Trump has been particularly pro-energy and pro-banking sector.
- Of course, while deregulation provides a reliable short-term boost to economic activity, the subject is much murkier with regard to the long-term effects. It goes without saying that it is bad to dispose of good regulations, and good to dispose of bad regulations. The challenge is sorting one from the other.
- The clear risk, in this case, is that reducing environmental regulations damages the environment and thus may do long-term economic harm (not to mention societal harm). Reducing financial sector regulation could increase the risk of a financial crisis somewhere down the line.
Greatest deregulation in environemental and financial areas
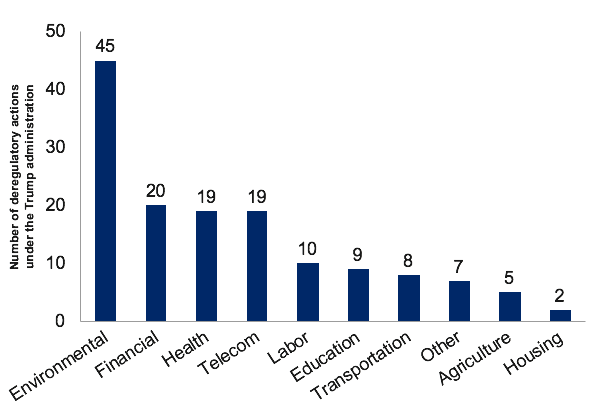
Note: As of 1/9/2019. Source: The Brookings Institution, RBC GAM