Global Investment Outlook:
- A reminder that our quarterly investment outlook, including a detailed macroeconomic assessment, can be found here
Financial market distress (Part 1/5): Unhappy markets
- Stocks had a miserable 2018, with the MSCI World Index down 11% on the year and the U.S. S&P 500 down 7%.
- Of course, this masks the intra-year fireworks that took place. From peak to trough, the MSCI World Index entered bear market territory by shedding just over 20% of its value. The S&P 500 came within a sliver of that label, falling by 19.8%.
- This performance was heavily back-weighted over the year, but nowhere more so than in the U.S. The S&P 500 Index was still up on the year as recently as early December.
- Meanwhile, the world’s other economic superpower – China – suffered the indignity of the largest annual decline among the major markets, shedding 25% in local currency terms and nearly 30% in U.S. dollars.
- Given the particularly sharp movements of the stock market in the final few weeks of 2018, logging multi-percentage point moves almost as a matter of course, it is no surprise that the VIX Index recorded some of its most elevated readings in years.
Financial market distress (Part 2/5): Retrospective perspective
- Of course, some perspective about recent stock market distress is useful.
- Recent volatility has partially been a function of elevated uncertainty and markets revising their assumptions about the future. But it has also been the result of extremely thin markets over the holiday period. Absent this special consideration, the rollercoaster ride would likely have been considerably dampened.
- Despite the recent sharp drop, the current level of the S&P 500 is still higher than anything ever recorded before September of 2017. Put differently, the compound annualized return of the S&P is still +5.7% over the past two years, plus dividends.
- Since the global financial crisis low of March 2009, the S&P 500 has still delivered a stunning 14.3% annualized return before dividends. Naturally, the return isn’t quite so exciting when framed relative to pre-crisis levels. But it is nevertheless remarkable that even investors who bought equities at the peak of the market in 2007 have managed a 4.3% annualized return (plus perhaps 2% of dividends) through to the end of 2018.
- Most investors hold a mix of securities, including not just equities but also bonds. The government bond market, in particular, has done its job admirably in recent months, providing ballast to balanced portfolios at precisely the moment that stocks have tumbled.
- For all of these reasons, the hit to the stock market is not quite as bad as it first seems.
Financial market distress (Part 3/5): Investment risks
- Let us now turn to the key risks to the outlook.
- First and most obviously, global economic growth is slowing. The latest Chinese PMI fell below 50 and leading indicators everywhere have steadily diminished across 2018.
- Second, there is reason to expect a further deceleration in 2019 as tighter financial conditions, protectionism and fading fiscal stimulus begin to bite.
- Third, the U.S. government shutdown, while only a small drag, is not helpful at a time when market psychology is precarious.
- Fourth, downside risks exceed upside ones by virtue of the lateness of the economic cycle and as expressed by the ongoing flattening of the yield curve (recently, via an especially unwelcome bull-flattener). We maintain below-consensus growth forecasts.
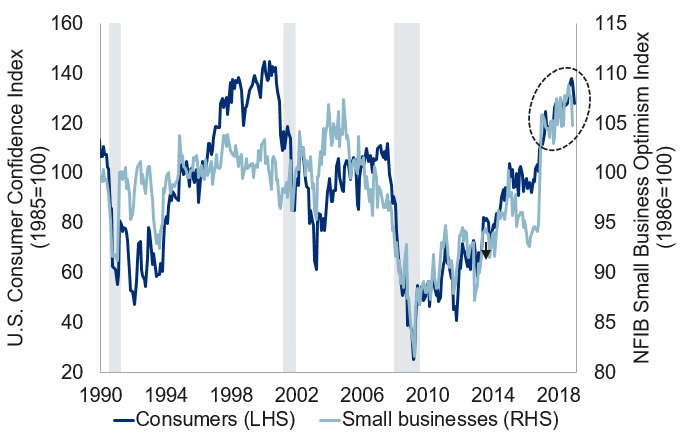
- Fifth, we must now worry about a vicious circle forming. So far, it is macro concerns that have translated into stock market weakness. Now, the question is how much recent stock market weakness will impinge upon economic activity. The latest Richmond Fed reading just tumbled to its lowest level in nearly three years, though it is known to be volatile. Other metrics, such as consumer and business confidence (see first chart), have only slipped modestly. But these readings predate the worst market carnage, and could yet fall further. As is often the case, much rests on human psychology and the extent to which bad news begets further bad news in the form of restrained consumer spending or tight-fisted procurement departments.
Confidence peaked?
U.S. consumer and business confidence still high, but waning
Note: Consumer Confidence Index as of Dec 2018, Small Business Optimism Index as of Nov 2018. Shaded area represents recession. Source: The Conference Board, NFIB, Haver Analytics, RBC GAM
Financial market distress (Part 4/5): New investment opportunities
- While the risks are undeniable, the potential opportunities are no less so.
- First, stock markets go up far more often than they go down. With global growth forecasts for 2019 in line with the five-year average, there is no reason to think that a declining stock market is pre-ordained.
- Second, for all of our concern about decelerating growth and higher interest rates, the market swoon has now arguably priced most of those challenges in. In turn, there would appear to be less scope for disappointment in the future. To the contrary, some prominent upside risks now exist.
- Third, from a technical perspective, the string of recent big daily gains in the stock market provide a favourable signal. Similarly, the Presidential Cycle argues that 2019 (Year 3) should be kind to the U.S. stock market. The correction has produced the kind of extreme sentiment swings that typically precede a directional change in markets (though much depends on the quality of the follow-through).
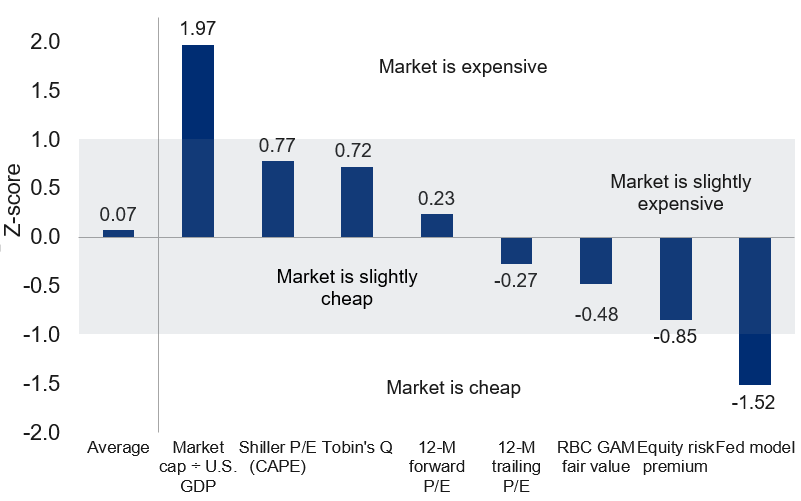
- Fourth, stock market valuations have now fallen nicely. Bloomberg calculates that U.S. trailing and forward P/E ratios are now both the cheapest they have been in more than five years. A compendium of valuation metrics now points to approximately average fair value after several years of expensive readings (see next chart). Our own fair value bands now argue that stocks have become outright cheap. Attractive valuations are one of the surest determinants of superior long-term returns, even if they have little impact on the short run.
S&P 500 Index
Normalized valuation metrics, as at December 2018
Notes: Historical data from Jan 1956 for Tobin's Q, 12-month forward P/E, Shiller P/E, 12-month trailing P/E, equity risk premium and Fed model. Historical data from Mar 1956 for market cap ÷ U.S. GDP. Historical data from Jan 1960 for RBC GAM fair value. Source: Haver Analytics, RBC CM, RBC GAM
Financial market distress (Part 5/5): Weighing risks and opportunities
- The challenge, then, is to weigh the risks and opportunities. Both are considerable.
- On the negative side, growth is slowing and recession risks are rising.
- Nevertheless, it provides substantial relief that the stock market has now factored in a considerable chunk of this diminishing macro picture. The resultant reduction in stock market valuations means that future stock market returns are less exclusively reliant on earnings growth. Returns can also come from superior dividend yields and normalizing valuations.
- We remain fairly close to home with our asset allocation, having incrementally reduced the extent of our risk-taking in both the equity and credit spaces over the span of 2017 and 2018. Furthermore, last fall we reduced our geographic exposure to U.S. equities and bought government bonds when they temporarily ascended to attractive levels. All of these moves have worked in our favour and are helping to cushion the effect of recent stock market weakness.
- From here, much will depend on how the technical picture unfolds, and the extent to which households and businesses react to recent financial market volatility.
Government shutdown:
- The U.S. federal government shutdown has now entered its second week with only minimal progress.
- In fact, negotiations may even become more difficult starting in January. Democrats will take control of the House of Representatives on January 3, providing another source of opposition to White House plans to fund a wall at the Mexican border. In fairness, Democrats already have considerable say in the budget negotiations, even before they gain the House, given that approval in the Senate requires a supermajority of 60 votes, whereas the Republicans only have 51 seats in 2018 (and 53 seats in 2019).
- President Trump is insistent on funding for a border wall, while Democrats are opposed to this. One possible compromise is to provide limited funding for border security, paired with a program to reintroduce work permits for so-called “Dreamers” (people who entered the U.S. illegally as children).
- Unless the shutdown stretches for months, it is unlikely to have an overly negative impact on the U.S. economy. As we noted in our previous weekly note, the last major shutdown, spanning 16 days in 2013, sliced just 0.1% from annual economic growth for that year. The damage should in theory be even less on a duration-adjusted basis as a significant chunk of the federal government has been pre-funded this time. Of more than two million federal employees, “only” 380,000 are not working due to the shutdown. In fairness, however, another 420,000 are working but temporarily not receiving their paycheque.
Other tidbits:
- U.S.-China relations, recently chilly as a trade conflict brews, have lately warmed slightly. U.S. President Trump had some positive words about a recent phone call with Chinese President Xi and recent negotiations more generally. In turn, President Xi proclaimed in a recent speech that “the open door will only grow bigger and bigger,” alluding to China’s orientation toward the global economy.
- Chinese economic data recently softened further. China’s Manufacturing PMI has continued its downward swoon, falling below 50 for the first time in nearly three years. In fairness, the simultaneously-released Non-Manufacturing PMI managed a slight gain off of depressed levels.
- The U.S. Federal Reserve raised its policy rate by 25bps to 2.375% on December 19th, as expected. While the statement and accompanying forecasts were clearly more dovish than the prior iteration, including a reduction of the expected number of rate hikes in 2019 from three to two and an acknowledgement of tighter financial conditions, the stock market expressed its displeasure. The problem is that the Fed was not as dovish as the market expected. It repeatedly described the economy as “strong” and maintained that “some further gradual increases” to the policy rate are appropriate. In contrast to the Fed’s two projected hikes in 2019, the market now prices in no activity at all over the year, and views a surprise cut as more likely than a surprise hike by early 2020.
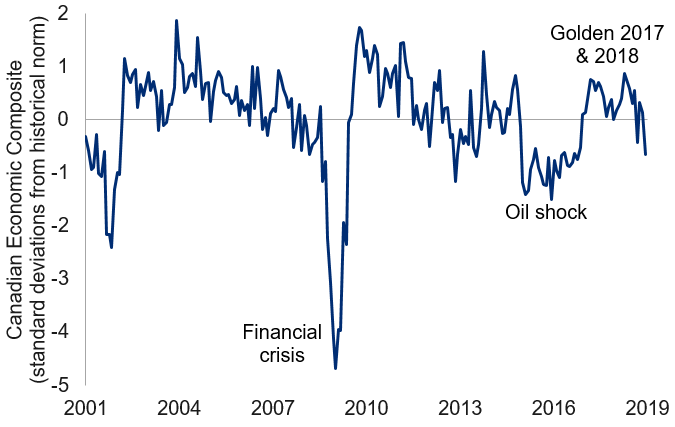
- The Canadian economy appears to be slowing. We are loathe to make too much of it as there have been several red herrings before. But the CFIB business barometer input into our composite measure took a particularly acute tumble and low oil prices combined with a more muted housing market should theoretically impinge growth (refer to chart, below).
Canadian leading indicator sends weakening signal
Canada to face stiff headwinds in 2019
Note: As of Dec 2018. Composite constructed using four leading indicators from surveys on Canadian businesses. Source: CFIB, Haver Analysis, RBC GAM