Webcast:
- We published our latest monthly economic webcast last week: "Green shoots emerge"
The twists and turns of U.S. GDP:
- U.S. first quarter GDP rang in with an impressive 3.2% annualized gain, slightly higher than expected.
- The performance was good in several ways:
- A 3%-plus figure in the post-crisis era is quite strong, particularly at a time when global growth was seemingly slowing, and coming as it did on the heels of financial market jitters.
- Initial tracking for the quarter had been for less than a 0.5% gain, so the quarter massively outperformed early expectations.
- The longest-ever U.S. government shutdown happened during the quarter.
- The U.S. economy has a history of downward seasonal distortions in the first quarter. This means that the first quarter is usually artificially weak, followed by a robust rebound in the second quarter of each year.
- That said, and in the long tradition of two-handed economists everywhere, GDP probably wasn’t quite as strong as it first looked:
- Most importantly, a disproportionate part of the growth came from inventory accumulation and net exports. These are perfectly reasonable motivations for economic production, which is what GDP measures. But, equally, let us recognize that it doesn’t necessarily tell us whether Americans were spending and investing.
- Digging into the report, final sales to domestic purchasers was just 1.5% higher on an annualized basis. This is an underwhelming increase in actual American spending. Consumption was up just 1.2% and fixed investment 1.5% higher.
- The bottom line is that U.S. GDP was fine, arguing that the U.S. economy continues to hold together reasonably well. More evidence will become available later this week. The ISM Manufacturing index is expected to remain around a healthy reading of 55. Non-farm employment is likely to be similarly positioned with a gain of close to 200K jobs in April.
- Three factors may help to explain U.S. stabilization and evidence of green shoots in other markets:
- Financial conditions have eased as central banks have become more stimulative.
- Protectionism fears have declined as the U.S. and China seem near a deal, and given a lack of auto tariffs (with the logical window for their application beginning to narrow).
- The global fiscal environment is becoming slightly more stimulative, if not in the U.S.
- Of course, the economic situation is never static. With growth now stabilizing after a long downdraft, the question is whether higher oil prices and sustained dollar strength could start to weigh on that happy trend.
Fed preview:
- The upcoming U.S. Federal Reserve meeting on Wednesday May 1 is likely to prove a fairly quiet one, in the sense that the Fed won’t update its official forecasts for the occasion, but also because the obvious pivot has already occurred.
- At its last meeting, the Fed retreated from a tightening to a neutral bias with regard to the fed funds rate. The Fed also mapped out the end of its quantitative-tightening operations.
- Since then, economic conditions have broadly stabilized and inflation has remained familiar (slightly weaker than expected PCE - personal consumption expenditures - but a higher oil price). None of this suggests a further change in course.
- No rate change is likely in the near term. Over the medium run, we suspect a rate cut is more likely than a hike, though neither is impossible. The market has priced in half of a cut by September.
- Overall, the most likely outcome is a meeting that aligns with market expectations. However, it is notable that the past few Fed meetings have reliably surprised in a dovish direction. It is just hard to think of how the Fed would go about pursuing such a goal without spooking the market with a needlessly rash shift to talk of rate cuts.
China vs U.S. supremacy:
- The Chinese economy has enjoyed remarkable growth over the past several decades, elevating itself to the status of global superpower and returning the world to a multi-polar existence after decades of U.S. hegemony.
- This is a substantial change and brings with it many implications for the world. These include the prospect of greater friction between the U.S. and China, the possibility of diminished globalization and greater Chinese influence over the world.
- However, the idea that it is only a matter of time before China completely wrests the controls from the U.S. is probably misguided, for two reasons.
- First, China is still a great deal poorer than the U.S., with a GDP per capita more than six times lower. Even with growth of 6% per year, it would take many decades to bridge the gap. Furthermore, as China becomes wealthier, its economic speed limit will naturally (in fact, has already substantially begun to) slow. In turn, the gap between the two will remain substantial for the foreseeable future.
- Second, and the main thrust of this analysis, China’s substantial population advantage is set to shrink over time.
- China is presently the world’s most populous nation, containing a remarkable 1.4 billion people. In contrast, the U.S. has a population of merely 330 million (though let the record show this is the third most of any nation, with India nestled between the two).
- A substantial part of China’s economic and geopolitical clout are the result of having 4.3 times as many people as the U.S.
- Fascinatingly, this advantage is set to shrink quite drastically over the coming century, as per UN projections.
- China’s demographic challenges are as follows:
- A fertility rate of just 1.62 children per woman – extremely low by developing country standards. Even with the country’s one-child policy now abandoned, the rate is showing only the barest of inclinations to rebound. Asian fertility rates are quite low in general. And as China becomes wealthier, the fertility rate is more likely to fall than rise.
- A working-age population that is already declining.
- An overall population that will peak in a decade (2029) and then begin declining.
- Rising longevity.
- A dependency ratio – the fraction of working-age adults to children and (especially) seniors that is already poor, and set to deteriorate significantly further.
- Little immigration and significant emigration.
- While the U.S. is hardly great shakes, it is better off in two key regards:
- The U.S. has one of the highest fertility rates in the developed world, at 1.80 children per woman. This is not great by itself, but is higher than China.
- The U.S. enjoys significant immigration.
- When these disparate influences are fashioned into population forecasts, the UN predicts that by the end of the century, China’s population will decline by 28% while the U.S. population will increase by 36%. The Chinese population declines from around 1.4 billion to “just” 1.0 billion. The U.S. population rises from around 330 million to nearly 450 million.
- Put together, China’s population will fall from 4.3x the U.S. level today to just 2.3x by 2099 (see chart).
-
China's population advantage already shrinking
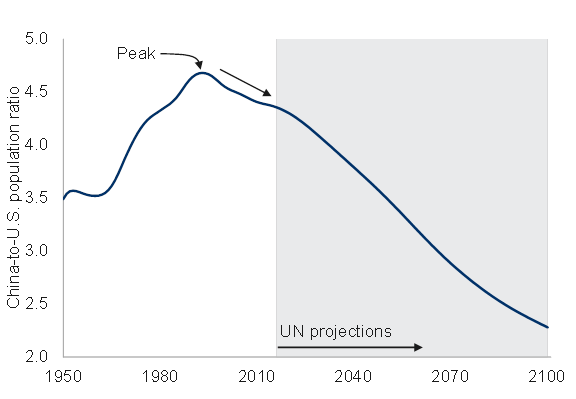
Note: Data based on World Population Prospects: The 2017 revision. Source: United Nations, Macrobond, RBC GAM
- Clearly, this still leaves China with a large population advantage and significant overall clout. But the notion that it is a one-way street to China’s permanent advantage is likely misguided. The U.S. may experience its own global renaissance as the decades pass.
- While no formal projections exist into the 22nd century, the trend of the UN projections leaves the distinct impression that the two countries’ populations will continue to converge for long thereafter.
- Why no talk about India, which will soon pass China to claim the mantle of most populace nation? In part because it is undergoing its own demographic transformation, with a plummeting fertility rate that has fallen by half since 1984 (to 2.3 children per woman) and continues to fall.
- Even more importantly, from an economic standpoint, is the fact that India’s GDP per capita is 4.5x less than China and 31x less than the U.S., meaning that the country is a long, long distance from wielding the economic might of the U.S. or China.
U.S. versus Canadian consumer confidence:
- The U.S. and Canadian economies are usually more alike than they are different. But in the case of the two nations’ consumers, the current positioning is unusually disparate (see next chart). v-container>
-
U.S and Canadian consumers on different paths
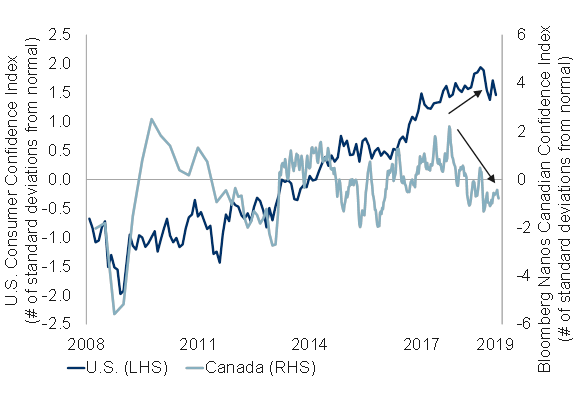
Note: U.S. consumer confidence as of Mar 2019, Canadian consumer confidence as of the week of 4/26/2019. Indices normalized using historical data since Q 2 2008. Source: The Conference Board, Nanos Research, Bloomberg, Macrobond, RBC GAM
- In the U.S., consumer confidence has risen to ever greater heights over most of the past decade, before going mostly sideways over the past year. Current U.S. confidence is a large 1.5 standard deviations above normal.
- In contrast, Canadian consumer confidence also rose somewhat over the past decade, but has spent the past two years in retreat, with the latest consumer confidence reading 0.8 standard deviation below normal.
- Thus, American households are unusually optimistic, while Canadian households are slightly pessimistic.
- Two interconnected factors help to explain this disparity.
- First, the personal savings rates in the two countries are quite different. The average U.S. household is saving 6.5% of its disposable income, whereas Canadian households save just 1.1%. For context, the first number is unusually high while the latter is unusually low. Another way of thinking about this is that Americans have the potential to increase their spending significantly if they were so inclined (or to resist a decline in spending if employment prospects were to worsen). Canadians, on the other hand, appear to be going flat-out already.
- Second, and related to this, Canadian households are significantly more indebted than in the U.S., with a household debt-to-income ratio of 183% versus 134%.
- The bottom line is that less should be expected from Canadian consumers in the coming years both given their attitude and their actual financial flexibility. This helps to explain why we forecast lower economic growth in Canada relative to the U.S. over that period.
Bank of Canada review:
- The Bank of Canada’s most recent meeting left the overnight rate unchanged at 1.75% but provided a further shift in a dovish direction.
- Some of this was expected: the central bank was widely expected to eliminate its reference to “future rate increases,” and it did.
- Similarly, the BoC downgraded its GDP growth forecast, as had been expected.
- However, the bond-bullish developments were even stronger than expected, on several fronts:
- The BoC didn’t merely downgrade its 2019 growth outlook – it used a hatchet, chopping 0.5ppt off the figure to leave a gaunt +1.2% growth outlook.
- The central bank also reduced its estimate of the neutral rate from the range of 2.5—3.5% to 2.25—3.25%, a quarter point downgrade.
- The output gap – the difference between current economic output and the economy’s full potential – increased from a midpoint estimate of -0.5ppt to -0.75ppt.
- What’s next? No change is likely in the near term, as per the central bank’s neutral bias. Furthermore, the federal election in six months could prove a mild deterrent to policy changes before then.
- However, technically, the Bank of Canada must believe it is more likely to continue raising rates than to cut them, as demonstrated by its base-case forecast that Canada’s remaining economic slack will be winnowed away over the next few years and that the current rate is below neutral.
- Our own view is that rate cuts are a bit more likely than hikes given the economy’s evident headwinds, the lateness of the business cycle and our sense that the neutral rate in Canada may be even lower than officially estimated. The market prices in about a quarter of a rate cut by September of this year.
Toronto economy in perspective:
- We usually assess the Canadian economy in the context of top-down influences such as monetary policy, protectionism and U.S. demand. Occasionally, we get more granular, delving down to the sectoral level by reviewing the oil sector, housing and the like. Alternately, we sometimes evaluate the prospects of individual provinces.
- But it is quite unusual for us to evaluate the economy at the municipal level. Today, we make an exception. For some time, we have had the impression that Canada’s biggest city – Toronto -- might be a disproportionate engine for prosperity and growth. How true is that idea? Only partially.
- Even the seemingly straight-forward task of defining the city is a tricky affair. The City of Toronto’s official population is 2.8 million people, but the arguably more useful Census Metropolitan Area (CMA) definition is a much larger 5.9 million.
- The idea behind a CMA is that arbitrary municipal boundaries aren’t helpful – what matters is capturing regions within which intensive commerce occurs. This broader definition spans just east of Hamilton nearly all the way to Oshawa.
- CMA Toronto is remarkably large: it is estimated to have generate a huge 20% of Canadian economic output, in the vicinity of that produced by Quebec or Alberta, more than that produced by British Columbia, and more than the output of the remaining six provinces combined (Saskatchewan, Manitoba, New Brunswick, Nova Scotia, Prince Edward Island and Newfoundland).
- From a population growth perspective, Toronto’s narrow definition adds around 25K net new people per year, while the CMA version adds more like 75K per year. This puts Toronto in the running for fastest growing North American city. It also helps to explain the many cranes in the city.
- While Toronto is very large and enjoys a significantly growing population, it falls slightly short of being a powerhouse from the perspective of economic growth. While the city has outgrown national GDP over the past two decades, its share of national output over the period has only increased from 18% to 20%. Thus, its economy grew about a tenth faster than the overall country, but no more.
- Similarly, despite obvious pockets of prosperity, one cannot claim that the city is materially richer or better off than other cities. For instance, Toronto’s GDP per capita lags well behind that of Regina, Calgary, Edmonton and Ottawa. And the city’s unemployment rate of 6.6% is higher than in many municipalities.
- Perhaps Toronto’s greatest achievement is the smoothness of its economic growth. The city seems to suffer less volatility in its growth trajectory, outperforming the rest during periods of economic weakness. This makes sense: Toronto is a disproportionately services-oriented economy, and the service sector tends to be smoother than the goods sector (refer to next chart).
-
Economic growth: Toronto vs. Canada
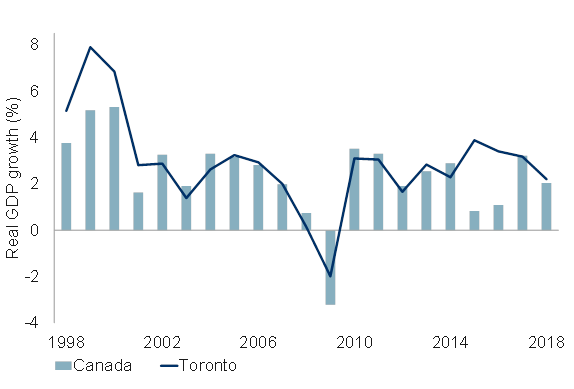
Note: As of 2018. Toronto's GDP growth is avgerage of estimates by the Confernece Board, Moody's and Oxford Economics, Canadian real GDP gowth of all industries. Source: City of Toronto, Macrobond, RBC GAM
- However, this doesn’t quite guarantee smooth sailing forever. It is worth appreciating that the most recent bout of Canadian economic weakness in 2015-2016 was the result of an oil shock. So it is no surprise that the pain associated with that experience was concentrated disproportionately in oil-producing regions. Furthermore, given the remarkable run up in home prices (and a concomitant deterioration in affordability), one might argue that Toronto is more vulnerable than most on a go-forward basis to any housing weakness.
- Lastly, it is worth acknowledging the vibrant tech sector within Toronto, which has played a significant role in the intensification of the downtown core in particular:
- As of 2017, the city contained 241K tech workers, putting it fourth among North American municipalities.
- The number increased by an incredible 51% between 2012 and 2017, representing the addition of 82K new workers.
- This growth was the fastest among any North American municipality, even slightly ahead of the San Francisco Bay Area.
- Of Toronto jobs, 9% are now in the tech sector.
- Toronto now contains 29% of the entire country’s tech jobs, and absorbed 41% of the country’s venture capital funding in 2018.
- Why has the city proven so attractive to tech employers? Much presumably has to do with an educated workforce and the dynamism of the city. Some cite government support and the political climate. But let us also recognize the cost advantage: the average tech worker in Toronto earns less than half of someone in the San Francisco Bay Area.
-With contribution from Vivien Lee