U.S.-China trade:
- Markets have recently recoiled at the deterioration of U.S.-China trade negotiations.
- A bit of backstory is useful. Globalization was an important driver of global economic growth over the past several decades, fueled by:
- trade liberalization efforts
- China’s ascension to the World Trade Organization (WTO)
- the dismantling of the Iron Curtain.
- This created prosperity for many. Several emerging-market countries saw their growth supercharged and were able to lift their citizens out of poverty. Multi-nationals benefited enormously from a mix of new markets to sell into and a cheap new supply of labour. The average developed-world consumer benefited from cheaper products and more choice.
- A proxy for the ascent of globalization is that the flow of trade reliably outgrew global GDP (see chart).
-
Globalization soared for decades, but is now wavering
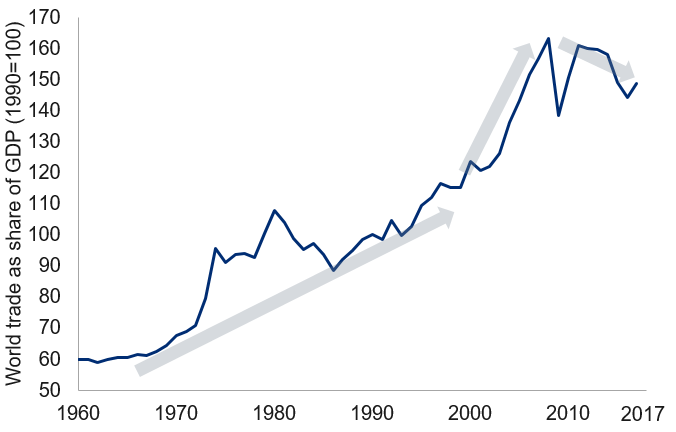
Note: As of 2017. World trade measured as exports of goods and services.Source: World Bank, Haver Analytics, RBC GAM
- However, not everyone benefited equally from globalization. Some people, classically those toiling in low-skilled manufacturing jobs in the developed world, saw their jobs disappear in part due to globalization. Economic theory argued that these people could be retrained and ultimately obtain better jobs in other fields. However, the actual result has left an underbelly of chronically underemployed people and economically-depressed regions across the developed world.
- As depicted in the next chart, the top 10%, 1% and 0.01% of the global income spectrum have done exceedingly well over the past four decades. The bottom 50% have also enjoyed big gains as the people of fast-growing emerging-market countries like China and India were lifted from poverty. But the global middle 40% – those with below-average earnings within the developed-world – secured much smaller increases in their income.
-
Winners and losers from globalization
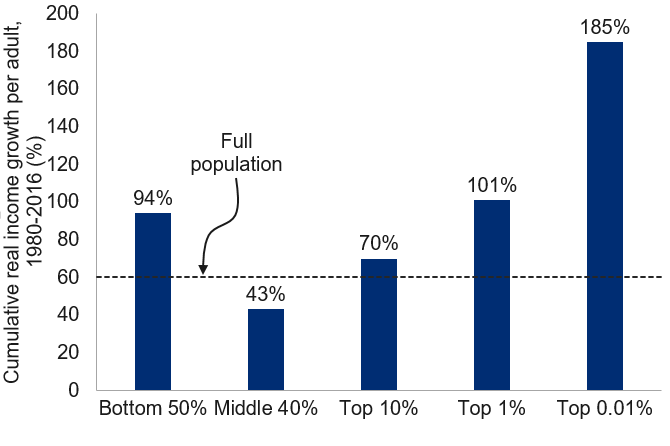
Note: Cumulative growth of average income of each income group of the world population. Source: World Inequality Database, RBC GAM
- The discontent that arose from this unequal distribution of globalization’s windfall has been a central motivator for the populism currently sweeping the world, and a catalyst for the isolationist, anti-trade sentiment contained within.
- In the U.S., anti-trade populism was a central element of President Trump’s campaign platform. It helps to explain the various efforts the White House has made to renegotiate America’s trading relationship with the world.
- In fairness, some part of the U.S. trade discontent is legitimate. As the following chart depicts, U.S. companies were paying higher tariffs on average when selling to foreign markets than foreign companies were paying when entering the U.S. market.
-
U.S. is right to want better trade deal with partners
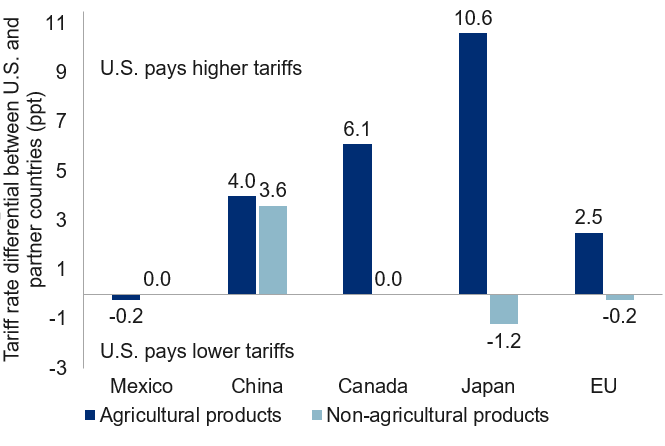
Note: Difference between tariff rates U.S. pays on its exports to partner countries and rates partner countries pay on exports to U.S. Source: WTO/ITC/UNCTAD World Tariff Profiles 2018, RBC GAM
- Another part of the motivation to renegotiate trade deals is less savoury, but no less valid: big countries like the U.S. have the ability to throw their weight around, extracting favourable deals in exchange for access to the largest economy in the world. The U.S. can reasonably aspire to better than a strictly “fair” deal.
- However, not all of the logic behind the desire to renegotiate is sound. For instance, far more U.S. manufacturing jobs have been lost to automation than to overseas factories. Thus, the great bulk of “lost” manufacturing jobs will not be recovered regardless of the trading arrangement.
- Protectionism tends to be an economic negative for a number of reasons. By far the most important factor is that the cost of things goes up, in part because importers must pay more, in part because domestic manufacturers encounter less competition and so raise their prices. This doesn’t capture the full nuance of protectionism’s ills, but it is the main component.
- On the positive side, the government gets to collect tax revenue from foreign companies. Also, some domestic firms thrive when relieved of their foreign competitors. But on the whole, the negative usually outweighs the positive. And it nearly always does when foreign countries retaliate in kind with their own tariffs.
- The U.S. protectionist effort has focused on three areas: the new NAFTA deal, blanket tariffs and the U.S. trading relationship with China.
- The new NAFTA deal – USMCA – was tentatively struck last fall. Yet it remains an open question whether a divided U.S. Congress will manage to approve it. We assign a 70% chance that the new deal eventually goes through versus 30% that it doesn’t. However, whether approval should be viewed as an economic positive or negative is an open question. Some wags have taken to describing the new deal not so much as NAFTA 2.0 but rather NAFTA 0.9 given the way that it impedes the auto sector and introduces a sunset clause. Of course, this is only when compared to the original NAFTA. If the alternative were no trade deal at all, the USMCA is vastly preferable. There is a very real chance that Congress dithers to the point that it becomes a policy matter for 2020 or later.
- Small blanket tariffs have already been applied to solar panel and washing machine imports. Somewhat larger ones are hitting steel and aluminum imports. The big threat going forward is that something similar is levied on the enormous auto sector. Nearly three months ago, the U.S. Commerce Department issued an opinion to the White House regarding whether national security laws could be used as an excuse for auto tariffs. The nature of the opinion is not yet known, but the White House must decide what to do with the recommendation by May 18. Given that nothing has happened over the three months since the recommendation was first provided, we are inclined to think auto tariffs will not be happening. Of course, should we be wrong (such as because trade negotiators are currently distracted by China), that would impose a material further negative for economic growth in the affected regions.
- Finally, there is the U.S. trading relationship with China. The U.S. has already imposed several rounds of tariffs on China, including tariffs on $50B of imports in August and tariffs on another $200B of at a 10% rate in September. China has mostly responded proportionately to these actions, hitting U.S. exporters with tariffs of a similar magnitude, though strategically targeted at different sectors.
- The U.S. originally imposed a deadline of December 31, 2018 for China to comply with U.S. demands. After this date, the tariff rate on the $200B of imports would increase from 10% to 25%. However, the deadline was delayed to allow further negotiations.
- The U.S. goal with all of this tariff pressure was to motivate Chinese economic reforms. These reforms would create a more symmetrical trading relationship with China, in terms of the volume of trade running in both directions, but more fundamentally in terms of access to one another’s markets:
- reducing the extent of China’s capital controls
- halting a pattern of forced technological transfers from western companies to their Chinese partners
- limiting the special advantages enjoyed by China’s many state-owned enterprises.
- A month ago, these negotiations were beginning to look quite promising, to the extent that we upgraded our odds of success and began highlighting the prospect of a “slightly negative” tariff scenario rather than our prior base case of a “negative” scenario.
- However, all of the positive talk has now vanished. The two countries are at loggerheads again. The U.S. says that China had initially agreed to legislate a wide range of economic reforms, but its latest edits to the proposed agreement have backtracked on many fronts.
- We have always been of the opinion that any deal would be fairly superficial and fail to fully address underlying frictions between the world’s two economic superpowers. But even that half-victory now seems elusive.
- The U.S. has now followed up on its long-delayed threat, raising its tariff rate on the $200B of Chinese products from 10% to 25%. It has also threatened a further set of tariffs on another $300B of imports from China (at a rate between 10% and 25%), potentially doubling the net impact again.
- China has retaliated, with new tariffs of its own on another $60B of imports from the U.S. (also at a rate between 10% and 25%).
- Markets are naturally unhappy with all of this. Recall that financial markets had rebounded since the beginning of 2019 for three central macroeconomic reasons:
- interest rates had stopped rising
- economic growth was starting to stabilize
- protectionist woes were fading. The last of these is no longer the case, and so the market recalibration is unsurprising.
- Fortunately, there is still more than a glimmer of hope. The two countries are still negotiating, and both have left some wiggle room. The U.S. is not immediately levying the new, higher tariff. Instead, the country is waiting until after goods already in transit have been received. This leaves a window of perhaps a week.
- China has done even more. Not only was its response to U.S. tariffs fairly restrained in magnitude, but its new tariffs will not apply until June 1. This leaves several weeks of room to resolve the dispute.
- Let us review the theoretical economic damage that accrues from protectionism. The following table gives a (very) rough sense for the likelihood of various scenarios playing out, and the approximate economic impact. There isn’t much precision to this analysis and it is also a moving target as tariffs and threats are lobbed back and forth. Furthermore, even if a certain tariff is levied, it matters enormously whether the tariff is ultimately in force for five weeks or five years.
-
U.S. trade scenarios looking worse again
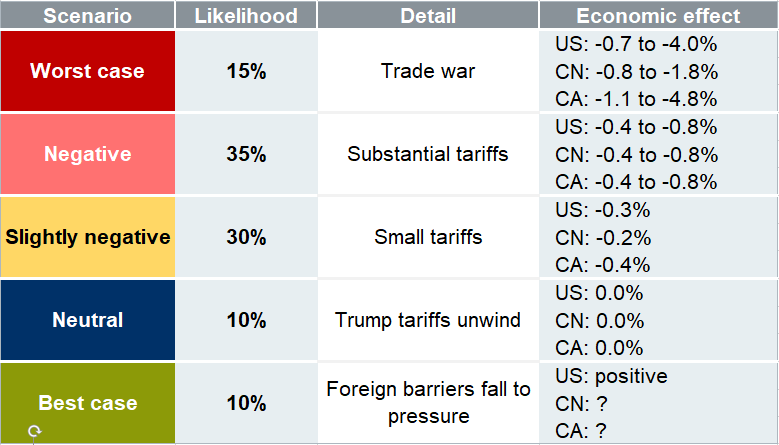
Source: RBC GAM
- After a brief interlude of optimism, we have returned to the opinion that the “negative” scenario is most likely, if only slightly. This points to economic damage of around 0.6% of GDP to the U.S., and a similar effect on China. By way of comparison, this is around twice the damage relative to if the tariff rate hadn’t recently gone up. Conversely, it is about half the damage relative to if the U.S. delivers on its threat of tariffs on another $300B worth of Chinese imports. We assume no auto tariffs.
- This is bad news and could yet compromise the recent green shoots both countries have evinced, unless cooler heads prevail.
- On the other hand, it bears mentioning that none of these figures are enough by themselves to drive the U.S. or China into recession, and indeed the damage is spread over a multi-year period rather than all accruing right away.
- Furthermore, the U.S. must surely be anxious to sustain economic growth with a 2020 election approaching. China must be equally so given its recent fiscal stimulus to stabilize growth. Perhaps this will help the two countries secure a deal after all.
Canadian provincial GDP:
- Canadian provincial GDP is only officially published on an annual basis, many months after the end of the relevant year. This staleness renders it of little use to investors.
- Several years ago, we remedied this information gap with our own provincial GDP proxies, created by combining a variety of high-frequency economic signals for each province via principal component analysis. The resulting estimates are not perfect, of course, but provide a reasonable estimate for how each province is faring.
- Our latest refresh of the model reveals several interesting findings (see table):
-
Province Current GDP growth rate
(YoY % change)Manitoba 2.4 British Columbia 2.1 Quebec 2.1 Nova Scotia 2.0 Newfoundland and Labrador 1.9 Prince Edward Island 1.9 Ontario 1.7 Saskatchewan 1.2 Alberta 1.0 New Brunswick 0.8 Note: RBC GAM estimate of provincial GDP year-over-year growth rate as of Mar 2019. Source: Macrobond, RBC GAM
- Alberta and New Brunswick are the worst economic laggards, growing by just 1.0% and 0.8%, respectively, over the 12 months through March. The Alberta story is well appreciated – an oil shock followed by sector-specific transportation constraints and resource-related regulatory uncertainty have greatly limited capital expenditures in the province. But New Brunswick’s growth has also been struggling, possibly even more so than Alberta over the past year. Lest this be viewed with skepticism given the occasional volatility of the model’s estimates for smaller provinces, let the record show that the latest Statistics Canada estimate for New Brunswick – for 2018 as a whole – had the province growing by just 0.1% year over year. A third province, Saskatchewan, runs only a little ahead of Alberta, challenged by many of the same issues as its neighbor (1.2%).
- Six provinces are clustered in a tight and fairly healthy range, with growth between 1.9% and 2.4% year over year. These are led by Manitoba (2.4%) and followed in order by British Columbia (2.1%), Quebec (2.1%), Nova Scotia (2.0%), Newfoundland (1.9%) and Prince Edward Island (1.9%).
- Finally there is Ontario, by far the largest provincial economy. It grew by an underwhelming but not strictly bad 1.7%.
- The provincial figures reveal a chronological pattern consistent with the national one: six of 10 provinces suffered a deceleration in growth over the past year. While this is but a bare majority, the six include Canada’s four largest provinces (Ontario, Quebec, Alberta and British Columbia, collectively responsible for 87% of the country’s output). The following chart shows the deceleration in Alberta and Ontario, with the former suffering a much more substantial deceleration than the latter.
-
Slowdown in both Ontario and Alberta
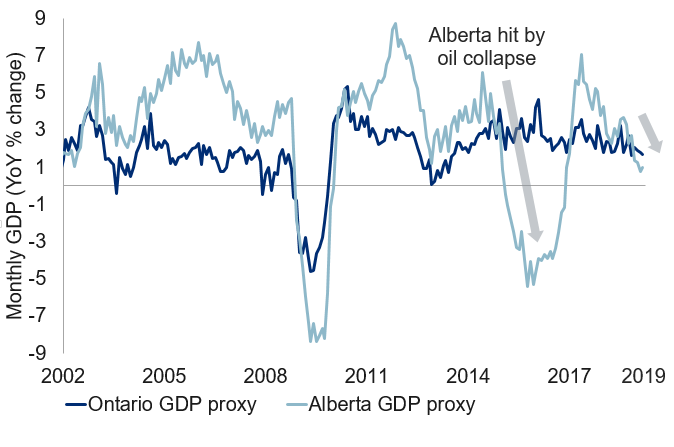
Note: As of Mar 2019. Monthly provincial GDP estimated from available monthly economic variables, combined via principal component analysis and then regressed against annual provincial GDP. Source: Macrobond, RBC GAM
- This provincial analysis brings with it several implications:
- First, it adds more evidence that the Canadian economy has indeed slowed.
- Second, the economic performance – at least as measured by growth as opposed to other metrics such as the unemployment rate – is worst in Alberta (unsurprising) and New Brunswick (less appreciated).
- Third, the synchronicity of the provincial slowdowns argue that this is not solely a story of oil prices gone wrong. Rather, it suggests that other nationwide headwinds are also at work, be they tighter financial conditions, a less favourable housing market or a raft of competitiveness challenges.
Canadian employment review:
- Canada created an astonishing 106K net new jobs in April, as per the Labour Force Survey. This was the largest addition in over four decades, and nine times the consensus estimate. “Normal” would be more like +15-20K.
- Supporting a positive interpretation:
- The details of the report were equally strong, with 73K of the jobs full-time, 84K of them private sector, and a balanced mix of goods and services positions.
- Despite an increase in the total number of job seekers, the unemployment rate also fell from 5.8% to 5.7% – just above the cycle low of 5.6% achieved late last year.
- We often comment that Canada’s employment report is notoriously volatile, and should only be examined on a trend basis. But the trend is also good: three of the last four months have registered large gains, and employment rose by a massive 2.3% over the past year, the biggest gain since 2007.
- Furthermore, Canada’s other, oft-neglected employment survey – the payroll survey (SEPH) – claims an even faster rate of job growth of +2.6% year over year (though the data only runs through February, rather than to April).
- There are nevertheless some weird things about this report when framed in a broader context:
- The Bank of Canada’s Business Outlook Survey reports that Canadian companies possess solid hiring plans, but that these have been generally weakening over the past year. It is thus strange to see so much hiring out of the blue, particularly when economic growth has broadly slowed over the period.
- In the same Business Outlook Survey, companies are now complaining notably less about labour shortages. It is odd that the unemployment rate is so low and hiring is so strong, and yet few are struggling to find capable candidates.
- When contrasted against underwhelming GDP growth, employment growth of 2.3% per year is positively stunning and means that Canada is managing only the barest of productivity gains. Indeed, Canadian labour productivity growth rose by just 0.1% across 2018, versus a normal rate of closer to 1.5%. This is bad news in that the prosperity of Canadians is barely increasing. It provides quite a contrast to the U.S. where productivity growth is finally surging after a long post-financial crisis malaise.
- What to make of all this?
- One cannot simply reject the latest job figures out of hand given corroboration from Canada’s other labour market survey and because the employment trend is also strong.
- However, it is difficult to reconcile labour market strength with economic weakness. We frankly don’t know what to make of it. The safest approach, for now, is simply to accept each, and to recognize that in combination they point to a middling situation – one that isn’t as bad as the GDP numbers suggest, but neither as good as the job numbers.
- In turn, speculation about Bank of Canada rate cuts probably needs to be put on ice as it would be highly unconventional to cut rates at a time of massive labour market strength. All the same, a brisk return to rate increases seems unlikely at a time when economic growth is limited. On hold it is.
U.S. Consumer Price Index (CPI) lands as expected:
- U.S. headline CPI came in at 2.0% year over year in April, up from 1.9% the month before. Similarly, core CPI rose from 2.0% to 2.1% year over year.
- The upward nudge came from a mix of economic tightness, protectionism and higher oil prices. We continue to forecast slightly above consensus inflation figures in the coming months as the first two of these factors continue to play out.
- However, the recent retreat of oil prices could limit any further fireworks in May. Likewise, inflation is unlikely to become a problem anytime soon given constrained inflation expectations, unfavourable demographics and technological deflation.