Watch this 10-minute video for a quick view as global economies start to reopen.
Overview
The COVID-19 news – and our own view of the situation – have skewed in a more positive direction over the past week.
Positives:
- The number of new COVID-19 cases continues to decline for the bulk of the developed world.
- One of many vaccines undergoing experimental trials has now reported positive results, increasing the hope that a permanent solution to COVID-19 may soon be found.
- As official economic data becomes available for April, it tentatively appears that the peak-to-trough decline in activity may have been slightly less steep than we had assumed.
- Similarly, as social distancing measures are eased, the rate of economic rebound appears to be surprisingly forceful.
- As such, there is a risk that our 2020 growth forecasts are too pessimistic.
- While we remain concerned about the timing and sustainability of the economic recovery, it seems increasingly plausible that countries can lighten restrictions by more than our simple math argued last week.
Negatives:
- There are notably fewer negatives than positives, though one of them is quite large. As economic activity has rebounded and some restaurants have even re-opened for sit-in dining in parts of the world, there is an obvious risk that this restart proves premature and excessive, resulting in a heart-breaking double-dip from an economic standpoint and a double-spike from a virus perspective.
- To a lesser extent, we must also be alert to second-round effects of the virus. For instance, Google searches for “unemployment” are seemingly morphing into searches for “bankruptcy” – suggesting lasting economic damage is still occurring even as activity rebounds off its trough.
Virus developments
Globally, there remain around 80,000 new COVID-19 infections per day. The trend is flat to slightly higher, with nearly 5 million people now infected globally (see first chart). Fortunately, whereas the daily infection trend appears to be flat or even slightly rising, the rate of deaths – a more accurate measure – has declined by around half between early April and late May (see second chart).
Spread of COVID-19 globally

Note: As of 05/19/2020. Spike on 02/13/2020 due to methodology change. Source: ECDC, Macrobond, RBC GAM
COVID-19 deaths globally

Note: As of 05/19/2020. Spike on 02/13/2020 due to methodology change. Source: ECDC, Macrobond, RBC GAM
Major developed countries can now nearly universally boast of transmission rates that are below the critical threshold of one. With each sick person infecting less than one additional person, the virus is therefore in decline (see next chart). Spain is doing particularly well, with many European countries also well below the key level. Germany, Switzerland, Italy and Spain have each managed to reduce the extent of their outbreak to the point that daily cases are now no more than a tenth of their earlier peaks. The U.S. now possesses a transmission rate that is just barely below one. Canada is somewhat lower and the U.K. is incrementally lower again.
Transmission rate above one suggests continued growth (based on new cases)

Note: As of 05/19/2020. Transmission rate calculated as 7-day % change of underlying 5-day moving average of new daily cases.
The U.S. state of Georgia has been a region of great interest given that it was among the earliest states to restart its economy. Despite the evident risks associated with lightening social distancing measures when the outbreak had showed little sign of abating in the state, the rate of infection has remained happily and surprisingly steady (see next chart).
State of Georgia

Note: As of 05/18/2020. Impact compares hours worked in a day vs. median for the same day of the week in January 2020. Source: Homebase, The COVID Tracking Project, Macrobond, RBC GAM
Conversely, prominent emerging market countries such as Brazil, Mexico, India and Iran are struggling to contain the virus, with transmission rates that remain above one. India is an initially perplexing case, as the country instituted among the more aggressive quarantines (see next chart), and yet the number of daily new infections has roughly doubled over the past month. One possible explanation may be that Google-based data really only captures the behaviour of the middle class and upper class in India, with many poorer Indians (lacking cell phones) less able to obey quarantining rules but not captured in the data.
Google mobility: Workplace

As of 05/17/2020. Note: Percentage change of hours worked by hourly workers in the U.S. Source: Google, RBC GAM
Revisiting the economic decline
Although the worst of the COVID-19 economic shock is now clearly fading – more on that later – we are still working to determine just how profoundly output initially declined. A sufficient amount of time has now passed that we can increasingly turn to proper, formal economic data rather than the fun-house mirror view provided by untested real-time proxies.
In general, the traditional data appears less extreme than the real-time data. Surveys and activity proxies initially claimed that:
- U.S. business revenues were down by as much as 44% (see first chart
- the hours of hourly workers were down by more than 60% (see second chart), and
- credit and debit card spending was nearly 40% lower.
All of these now appear to have exaggerated the extent of the decline in GDP.
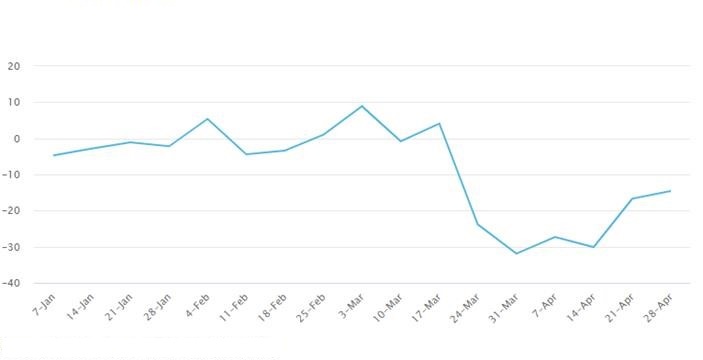
New orders and sales of U.S. businesses hammered by COVID-19

Note: Estimated as weighted average of % change in new orders or sales for all respondents. Source: Weekly Business Outlook Survey on the COVID-19 Outbreak, Federal Reserve Bank of Philadelphia, RBC GAM
Percentage change of hours worked by hourly workers in the U.S.

Note: As of 05/10/2020. Impact compares hours worked in a day vs. median for the same day of the week in January 2020. Source: Homebase, Macrobond, RBC GAM
In the U.S., a rush of April data has just been published. Retail sales fell by 16.4% during the month, making for a cumulative decline of 23.3% since February. The inflation-adjusted decline is slightly less extreme given that prices were likely falling over the period. This hardly captures the entire breadth of consumer spending. Non-discretionary spending on such obligations as rent or a mortgage aren’t included and are unlikely to have fallen quite as aggressively. But it gives a pretty good sense for what the consumer has been up to.
In turn, it highlights a downside risk relative to the consensus outlook, but an upside risk relative to our own assumption of a peak-to-trough decline in U.S. consumer expenditures of 25% to 30%.
Industrial production data for April was down by 11.2%, with the cumulative decline since February now 15.2%. This was a bit better than the consensus. We had assumed a peak-to-trough decline in business investment of 20% to 25%, though the two measures are not exactly analogous.
Collectively, the retail and industrial production data releases argue for a milder peak-to-trough decline than the overall 22.5% drop we have been assuming for the U.S. However, they do not constitute the final word on the subject. Crucially, many sectors are missed altogether even when these two measures are combined, and these monthly numbers likely picked up a partial rebound over the second half of April as restrictions began to ease. As such, the true peak-to-trough decline in each sector was probably somewhat closer to our estimate, but not likely in excess of it.
Other developed countries are still mostly stuck with March economic data, though most recorded worse figures in that month than the U.S. did, suggesting that our hypothesis that other countries have suffered a fiercer economic decline than the U.S. is likely correct.
A handful of international economic indicators from April help to illuminate the magnitude of the economic decline and provide interesting perspective:
- In Japan: Japanese vehicle sales fell 25% relative to the year before, machine tool orders are down a stark 48% and Japanese business bankruptcies are now up by 15.2% relative to the year before.
- In Canada: Canadian existing home sales are down 57% in April relative to March, and down by 63% versus February. Canadian shopping malls report collecting just 15% of May rent from tenants. While this is a much sharper decline than one might initially imagine, keep in mind that shopping malls are mostly closed and so such retailers may feel no obligation to make rent when their landlord is preventing them from doing business. One imagines the street-based retailers are paying their rent at a higher rate.
- In the U.K.: new car registrations were down by 97.3% versus the year before, to the lowest level since 1946.
Household incomes
Last week, we estimated that the net hit to household incomes had actually been quite mild despite a huge drop in hours worked. The resilience of higher wage jobs, sources of non-labour income and, most importantly, government stimulus have combined to nearly plug the hole in both the U.S. and Canada.
Goldman Sachs recently performed a similar exercise, calculating that U.S. household incomes may even rise somewhat across 2020, and estimating that a remarkable 74% of the people laid off due to COVID-19 are enjoying higher earnings via government benefits than they would have at their job.
Reconciling job numbers
The labour market has been massively affected by COVID-19. Job losses so far have proved smaller than several proxies had hinted at.
Last week, we gained a better understanding for how “only” 3 million Canadians have lost their jobs through April, yet nearly 8 million people have applied for the CERB government benefit. The answer involves some combination of job losses that will be captured in the May employment report, a large 2.5 million Canadians who have lost more than half of their hours yet remain technically employed, with the residual presumably people who suffered more modest hits to their income or who were already unemployed.
In the U.S., a similar mystery revolves around the fact that there have been a colossal 36.5 million initial jobless claims filed since the quarantine struck (see next chart), yet “only” 21 million official job losses through the April payrolls report. Again, some of the difference will presumably be resolved by further job losses captured in the May report, but it is unlikely that there will be anything like 15 million job losses in May, particularly as the economy starts to revive. How to reconcile the gap? There appear to be a few other considerations at play:
- Given the sudden arrival of quarantining and the inability of many U.S. states to handle the surge of demand, processing times have been unusually long. In turn, presumably out of desperation, many applicants have apparently applied more than once. Florida may be the most extreme state, where only around 1 million out of the 1.8 million official jobless claims submissions since late March are believed to be unique.
- Seasonal factors may explain as much as a few million of the layoff differential.
U.S. jobless claims skyrocket as cities and states go into lockdown

Note: As of the week ending May 9, 2020. Source: DOL, Haver Analytics, RBC GAM
Demonstrating the extent to which double-counting has distorted the U.S. numbers, continuing jobless claims are up by 21.0 million since the week of March 14. This almost precisely matches the official decline in employed people across March and April. Furthermore, the latest week shows the smallest net rise in unemployment insurance recipients since the onset of the COVID-19 quarantine. It is likely no more than a matter of a few weeks before the number of continuing claims begins to decline.
Why is a recovery now taking hold?
There is now ample evidence of an economic recovery starting as early as the middle of April, and quite clearly underway in certain markets in May.
We hypothesize that this burgeoning rebound is a function of four things.
- Government rules ease
First and most obviously, governments are beginning to ease restrictions. Business sectors are being incrementally re-opened and social distancing measure are being lightened. Oxford University maintains a social distancing stringency index for each country, and reports, for instance, that Italy’s stringency has just diminished from an extreme score of 95 to 69 as of early May.
- Less panic among households and businesses
A variety of confidence measures have begun to rebound, including crucial small business indices in the U.S. and Canada. People now understand the approximate parameters of the virus and its consequences: while entirely serious, COVID-19 isn’t killing 50% of the population, civil society has not broken down, there haven’t been extreme food shortages, the quarantine will not last forever, governments have stepped up with fiscal assistance, and the global financial system is holding up fairly well so far.
As mentioned earlier, household incomes – on average – have not been affected too badly, and businesses are beginning to see their revenues revive.
In turn, both groups are presumably more willing to behave normally, at least so far as social distancing rules permit. This includes spending more money.
- Adjustments are occurring
The imposition of quarantines initially created barriers that prevented households and businesses from buying things, and businesses from engaging their workers. Even before the quarantines began to ease, the economy was reorienting itself. Case in point, U.S. credit card data shows that online shopping has increased from 15% of total spending to 30% since the quarantine struck. People are finding new ways to get what they need. Similarly, one has to imagine that employees and businesses are getting significantly better at remote work, in terms of hardware, software and best practices.
- Government cheques arrive
While governments were remarkably quick at cobbling together massive stimulus programs by the standards of giant bureaucracies, the mechanics and logistics of applying for special programs, determining eligibility and writing and mailing cheques were such that there was a lag between when people and businesses lost income and when the government replaced it. The money has now arrived, permitting a rebound in activity.
Evidence of an economic rebound
The actual evidence of an economic rebound is disproportionately centered on the U.S. In part, this is because a number of U.S. states have been among the most enthusiastic in lifting social distancing restrictions, and in part because the U.S. happens to have the richest set of real-time indicators.
Consumer transaction data provides a particularly clear window into actual economic activity. One measure of U.S. credit card and debit card data was down by 36% on a year-over-year basis in late March, whereas it is now down just 9% in early May. In other words, three-quarters of the economic decline has since been recovered. It should be ceded this is the most optimistic claim among the many measures we examine.
In Georgia and Texas – some of the most precocious U.S. states – restaurant spending has already recovered roughly half of its earlier decline despite the sector being among the most difficult to restart. Somewhat less promisingly, the number of online restaurant reservations being made across the U.S. has now recovered around one-twentieth of its decline. A sampling of hours worked in different states uncovers quite a varied experience, with the best performers managing to recover perhaps a quarter of their earlier decline.
Impact on hourly workers

Note: As of 05/10/2020. Impact compares hours worked in a day vs. median for the same day of the week in January 2020.
Other real-time measures argue that U.S. steel and lumber production are now rebounding significantly, and even that movie theatre revenues are rising substantially (though still extremely low).
In Canada, published RBC data indicates that just over half of the initial 32% decline in credit and debit card spending was recovered by late April (see next chart). This is not quite on the order of the U.S. rebound, but still quite substantial and does not yet reflect any further revival in May.
Green shoots after all?
Spending relative to pre-COVID average in 2020 (% change)
As of May 2020. Source: RBC Economics, RBC Data & Analytics
Slightly staler data from the Netherlands indicates that one-third of the decline in credit card spending there has since been recovered.
Providing a fresher but less precise view of economic activity by country, Google Mobility, Apple Mobility and Oxford University social-distancing stringency data all provide a sense for the extent to which people are moving around and generating economic activity. Our index combining the three measures (see next chart) shows a varied experience by country, but with a rebound visible everywhere. Several countries have reclaimed around a third of their decline.
Severity of lockdown varies by country
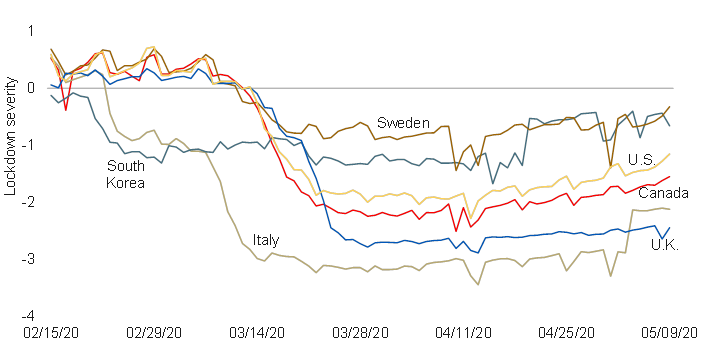
Note: As of 05/09/2020. Deviation from baseline, normalised to U.S. Source: Google, Oxford, Apple, Macrobond, RBC GAM
Of course, there is a danger that – much as the official economic data never declined as precipitously as the real-time proxies predicted – the official economic data may later fail to confirm as eager a rebound as some of these measures claim. There is already some tentative evidence in support of this risk: Redbook retail sales – a measure that aligns fairly closely to the definition of retail sales yet offers the advantage of a weekly frequency – has staged only the slightest of rebounds even as credit card activity has soared (see next chart).
U.S. retail sales start to bounce after lockdown
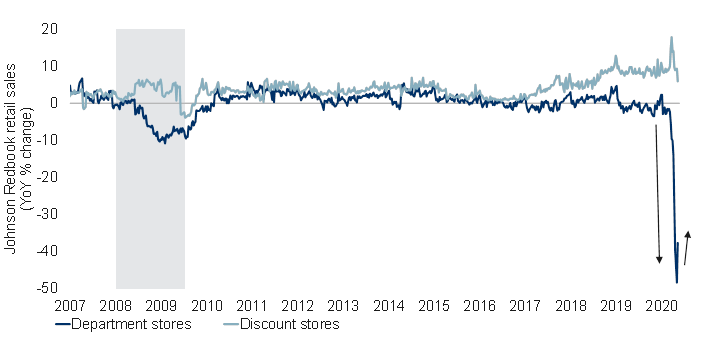
Note: As of the week of 05/09/2020. Department stores series includes traditional department stores and a small percentage of apparel stores. Shaded area represents recession. Source: Redbook Research, Haver Analytics, RBC GAM
It is inevitable that with a subject as inexact as economics, not every data point reaches the same conclusion. Goldman Sachs’ measures of U.S. industrial activity point to a nearly 20% decline relative to a year ago, with only the slightest of subsequent unwinds. The bank’s measure of consumer activity remains down 70% with no evidence of any recovery at all through the first week of May.
Further obscuring the proper conclusion, it is undeniably strange that certain measures of consumer spending are reviving despite the fact that the total number of unemployed people has continued to rise in the U.S. through early May. A declining workforce can perhaps be reconciled with more spending given earlier observations about household incomes proving surprisingly buoyant. But the second implication is no less relevant: if companies are still actively laying off, it is hard to fathom that they are enjoying a particularly large rebound in sales.
Some measures simply indicate that the pandemic is shifting from its obvious first-round effects to possibly more pernicious second-round ones. Google searches in the U.S. and Canada for the words “layoff” and “unemployment” are falling, whereas searches for “bankruptcy” are rising sharply (see next two charts).
Google searches in distressed times: U.S.
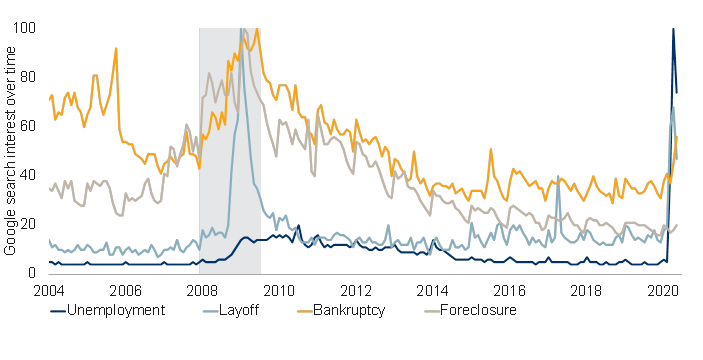
Note: As of May 2020 (partial data used for the month). The number of Google web searches for the topic relative to the total number of searches on Google over time is scaled and normalized to arrive at the search interest over time. Shaded area represents recession. Source: Google Trends, Macrobond, RBC GAM
Google searches in distressed times: Canada

Note: As of May 2020 (partial data used for the month). The number of Google web searches for the topic relative to the total number of searches on Google over time is scaled and normalized to arrive at the search interest over time. Shaded area represents recession. Source: Google Trends, Haver Analytics, RBC GAM
Finally, the Chinese economic model continues to provide an aspirational guide to how the rest of the world might hope to recover its lost economic output. While the rebound there has been substantial, with simple metrics like coal consumption now even higher than their equivalent pace in 2019, most measures still indicate the economy remains palpably weaker than normal even three months after the virus had been tamed. The Financial Times’ Chinese economic activity index has bounced, but remains short of normal. Goldman Sachs’ Chinese measures of industrial and consumer activity both show substantial rebounds, but leave industrial activity still failing to recover about a quarter of the earlier decline. Meanwhile the consumer activity measures are more damning, indicating that only slightly more than half of the decline has been recovered, with consumers reluctant to fully engage.
How to reconcile this deluge of data? Some of it is outright contradictory, but such is life when dealing with economic data. Overall, it seems very likely that a recovery of some sort has taken hold, though we are dubious that anything like three-quarters of the economic decline has truly been recovered. For now, we continue to think that the rebound is only occurring incrementally, with a full return to economic normality unlikely for quite some time – particularly when one thinks about the enduring undershoot that is likely in such sectors as tourism, entertainment and restaurants. We continue to assume economies do not reclaim their prior peaks before early 2022.
Dangers of recovery
Economies do not reopen without accepting a certain amount of risk.
Last week, we discussed the limited space available to lessen social distancing measures in even the most successful countries. To illustrate, in places like Italy that have reduced their transmission rate from what appears to be a natural rate of around three (each sick person infects three others, barring special social distancing rules) to around 0.7, these countries can theoretically only ease up to 13% of the special measures they introduced before the transmission rate rises back above one and the disease begins to accelerate anew.
Simplistically, one might imagine this limitation to mean that one out of every eight households can be allowed to resume their normal life, but not the other seven. And perhaps one out of eight businesses that are currently closed can be permitted to re-open, but not more than this.
Alternately, to the extent it is more realistic to allow every household to do a bit more than before rather than to allocate the entirety of the easing to a small subset of people, every household might be allowed to visit two or three stores per week rather than one, and perhaps to send one employed person to their office for one day per week. This is still radically less than normal, and falls well short of a full economic rebound.
Could more be possible?
However, as we have thought more about the subject of reopening over the past week, we have gained a measure of hope that more vigorous strides toward normality are perhaps possible, albeit not a complete normalization.
After all, quarantining at home is not the only thing that has changed over the past few months:
- The rate of daily testing for COVID-19 in the U.S. is now 15 times higher than it was two months ago, with similar improvements elsewhere. This reflects a greatly expanded capacity to identify infected individuals, isolate them, and alert connected people.
- The disease is now somewhat better understood, including the identification of a broader set of potential symptoms, the extent to which symptoms can be minor, and the existence of a significant number of asymptomatic cases.
- Medical capabilities have improved as ventilators are constructed, treatment methods are refined, masks and other protective equipment are acquired, and hospitals have expanded their capacity.
- The particularly acute vulnerability of places such as senior care facilities is now better understood. To the extent they represent 80% or more of total fatalities in some jurisdictions, retaining extreme quarantining and protective measures in those places should have a disproportionate impact on keeping the ravages of COVID-19 at bay. That said, it is naïve to think that any easing of social distancing outside of senior care facilities will have no effect within them – workers circulate between the two worlds.
- Conversely, to the extent some regions – particularly rural areas – managed to avoid intense COVID-19 outbreaks, they are in a position to ease social distancing rules to a greater extent than the average.
- Even as people return to their normal activities – going to work, going to stores and even interacting more – they are now more accustomed to wearing masks and maintaining proper distancing. These protocols were not as well understood, let alone implemented, by the average person as of early March.
- Similarly, as businesses reopen, they are upgrading their facilities and procedures to create a safer environment for workers and customers. Examples include installing plexiglass shields between customers and employees, staggering shifts, reducing the density of offices, limiting the number of customers in a shop, cleaning more intensely and more frequently, and so on.
- It remains mostly speculative at this point, but many larger companies appear to be working toward testing each of their employees before they return to work and perhaps even on an ongoing basis as a means of increasing safety.
All of this suggests that life can likely return more than 13% of the way to normal. Of course, our 13% figure is with specific regard to countries like Italy that have had particular success in taming the spread of COVID-19 via extreme social distancing measures. To the extent that other countries like the U.S., Canada and the U.K. have barely pulled their transmission rates below the critical threshold of one, there would appear to be much less room to change anything. But even here, that probably represents an underestimate, as fatality figures suggest that the rate of transmission may be lower than officially estimated, and the easing of social distancing measures so far has not yielded a visible spike infection spike.
While the Chinese economy has not returned all the way to normal, it has nevertheless staged quite a significant rebound, with more than half of consumer spending arguably recovered and an even larger fraction of industrial production. This makes the case that a significant return toward normal is possible.
However, we highlight several caveats:
- The Chinese quarantine was much more aggressive than in the developed world.
- The quarantine didn’t last as long (with the implication that less lasting economic damage was done).
- COVID-19 never really spread in a significant way outside of the Hubei province in China (so ongoing social distancing was much less necessary outside of that region).
- China didn’t end its quarantine until the daily new virus count was down to around 0.1 per million inhabitants.
In contrast, other countries have begun to reopen their economies when there are still between 20 and 130 new cases per million inhabitants. Success on the order of China’s economic rebound is far from assured.
South Korea remains the gold standard for controlling COVID-19 to the extent it never suffered an outbreak on the scale of China or anywhere else. Its keys to success have been mask-wearing, aggressive testing and sophisticated tracing.
It seems as though the rest of the world is moving toward these capabilities and therefore this model. But mask wearing remains significantly less universal outside of Asia, and South Korea had the great advantage of never suffering a high number of cases. It was much easier to engage in detailed testing and tracing when the daily virus count never exceeded 1,000 and has more recently been in the low double digits.
Indeed, South Korea now has the luxury of spare testing capacity, such that when a recent mini-outbreak occurred, it was able to significantly ramp up its testing and target the exposed group (see next chart). Other countries do not yet enjoy the luxury of spare testing capacity, and one hears very little about the extent to which sophisticated tracing is occurring outside of a handful of especially proactive countries.
COVID-19 diagnostic testing in South Korea

Note: As of 05/18/2020. Positive rate calculated as 3-day moving average of new cases/new tests. Source: Our World in Data, ECDC, Macrobond, RBC GAM
Additionally, we are nervous about the sequencing of social distancing measures. For instance, the opening of inherently social institutions such as sit-down restaurants and churches was expected to come at the very end of the re-opening process – perhaps not until 2021 – and yet a significant fraction of jurisdictions are already allowing them to open. Granted, many have reduced their maximum capacity, but it still highlights that the plan to incrementally re-open sectors based on which are necessities and which can ensure a good amount of social distancing has seemingly been forgotten.
Even as we adjust to the fact that the initial economic rebound is proving more forceful than we had expected, we stick with our view that a full return to the pre-COVID-19 level of economic activity is still quite some time off. This is partly a function of sectors such as tourism and travel remaining depressed for the foreseeable future. It is partly because some entities have already made clear that life will not be fully back to normal even by the fall – for instance, California universities plan for their fall semester to be conducted online. And it is significantly because we continue to anticipate some lingering restrictions from governments, and the surfacing of lasting damage done to a variety of economic actors.
But what is perhaps most apparent is how little we really understand the spread of COVID-19, and therefore the trajectory ahead. It is surprising that economic activity is reviving thus far without a concomitant rebound in the number of new infections. But it was equally surprising that the number of infections did not fall more radically when the quarantine was at its most extreme. How was the virus reproducing at all with few people leaving their homes?
Meanwhile, countries that are trying quite hard to control the virus such as India are suffering a rising toll, while others such as Sweden that have taken a looser approach are enjoying a declining virus count. With all of these tangled mysteries, it is folly to suggest we can predict the future with anything resembling precision.
Medical solutions
The U.S. Food and Drug Administration reports more than 400 clinical trials planned or underway of vaccines or therapeutics to treat COVID-19. This is unprecedented.
Among proper vaccines, Moderna recently announced positive results in its Phase One trial, with participants building significant antibodies while suffering minimal adverse effects. Phase Three may start by July, with vaccine production possible by the beginning of 2021. Other large pharmaceuticals also have big efforts underway, including Johnson & Johnson and Pfizer. The latter has even talked of a vaccine being available for emergency use as early as this fall. Meanwhile, China continues to make a big push of its own, and has committed to share any promising findings with the rest of the world. Mass production will remain a challenge, however, with the world’s capacity for vaccine production dwarfed by potential demand.
Some experts believe a therapeutic drug is the more likely solution to COVID-19, to the extent such a product can likely be developed and produced more quickly. Prominent products under development include hydroxychloroquine (apparently being used by President Trump already), remdesivir and a Japanese chemical called favipiravir. Research continues down many other avenues, including the use of HIV cocktails and blood thinners.
Another promising avenue of medical research is extracting and deploying the antibodies from people who have previously been infected with COVID-19.
The bottom line is that it remains possible that a quick fix (via therapeutic) or a medium-term solution (via vaccine) will be found, cutting short the need for enduring social distancing. However, pharmaceutical research is notoriously slow and inexact, and plagued with disappointment. Perhaps this time is different to the extent a concerted push is being made across much of the world, but the solution to some diseases has proven elusive despite decades of intensive efforts.
Declining globalization
Many look for a further decline in globalization as a result of COVID-19. In the short run, they are almost certainly right. Immigration is being stymied by extreme border control, weak economics translate into diminished trade, and governments talk of on-shoring critical industries.
Over the long run, we are dubious that immigration patterns will change significantly (more on that in the next section) and while other aspects of globalization may retreat, we posit that this is mainly for pre-existing reasons rather than due to the pandemic.
Globalization has already been fading for over a decade and was on track to decline further before COVID-19 arrived. This is a function of several things:
- Prior decades of trade deals had already driven tariffs to very low levels, leaving less room for further trade intensification going forward.
- The world has become more homogenous over time, with wages converging between countries such that the gains from trade have diminished.
- Prominently, U.S. protectionism predates COVID-19, as does rising global antagonism against China.
- Before COVID-19, companies were already widely reporting that they planned to diversify their supply chains away from China, with a significant push toward Southeast Asia, India and Mexico. China is simply no longer the low cost producer, though it retains an attractive domestic market and enviable infrastructure and stability.
- Similarly, there was already ample talk about on-shoring production, in part for geopolitical reasons, but also because labour costs are becoming less relevant as automation increases.
Having established that most of the de-globalization story has nothing to do with COVID-19, it is fair to concede that it could be spurred slightly further by COVID-19:
- The first lesson of COVID-19 is the value of supply chain diversification. When China went into quarantine, a significant fraction of the world’s multinationals suddenly found themselves without a viable means of producing their products. Companies will be slightly more inclined to spread their production across multiple countries, though Chinese production was disrupted only briefly when compared to the shutdown in many other countries.
- The second lesson of COVID-19 is the importance of national security considerations, not just with regard to traditional goods such as military items and food, but now also for medical products. As such, one can easily imagine an on-shoring of medical devices and products such as masks, ventilators and drugs that proved hard to secure during the pandemic. However, these represent only a small share of the flow of international trade, and so don’t really change the equation much.
In the end, while businesses will emerge from this experience with a greater appreciation for a robust supply chain, they are unlikely to shift the bulk of their production from one country to another when COVID-19 has demonstrated that virtually every country is ultimately vulnerable to a global pandemic. Furthermore, they cannot afford to ignore production costs altogether. It still doesn’t make sense to shift most production from the developing to the developed world.
Immigration implications
As noted earlier, it seems entirely reasonable to expect diminished immigration in 2020, and perhaps even in 2021. The Australia government has projected 300,000 fewer immigrants than normal over that period – a large fraction of its normal intake.
In the short run, borders are effectively closed, precluding easy travel. International consulates and embassies must obey social distancing orders, resulting in fewer interviews of prospective immigrants. The processing of written applications will inevitably be slowed by immigration administrators working from home. Potential immigrants may be reluctant or unable to migrate without good job prospects, and given the complexities of having to quarantine upon arrival despite the simultaneous need to find a place to live, furnish it, and integrate into society. With online classes extending into the fall, “international” students can study from their home country.
Less immigration in the short run would normally be a big problem for economic growth given that population growth represents as much as half of GDP growth in recent years. Yet the scale of the negative economic shock in 2020 (and, potentially, the economic rebound in 2021) is such that this isn’t a central issue for short-term economic forecasting.
Over the long run, we are not convinced that immigration must be all that different than before.
The U.S. is undeniably engaged in a multi-year push toward isolationism, reducing its number of foreign students, limiting illegal immigration and constraining other forms of immigration. But this predates COVID-19, and could well reverse depending on whether President Trump wins a second term or is replaced by the Democratic nominee in November.
For the rest of the world, official immigration policies have not changed much, nor has there been an outcry for such changes. Canada continues to accept immigration applications as usual, and appears to remain committed toward robust immigration as a means of generating long-term economic growth and increasing the country’s international clout.
While the willingness to get on an airplane should be temporarily – and maybe even enduringly – depressed, let us not exaggerate the situation. The latest air traffic data for China is already back to 64% of December levels, and that is without a large chunk of international travel. People would appear to be getting back on airplanes. Furthermore, it is one thing to shy away from a weekend holiday because of anxiety about being in an enclosed space for several hours; it is something else entirely to decide not to pursue a brand new life for that reason. Immigrants are, by definition, risk-takers.
To be sure, the housing market will be greatly affected by whether immigration revives or not. With the bulk of population growth in the developed world coming from immigration, the need for new dwellings is a direct response to immigration. As such, one might imagine a slightly cooler housing market in the short run as construction temporarily exceeds supply (not to mention diminished household income, risk aversion and all of the other COVID-19 effects). But it is unlikely that the fair value of a house has dramatically changed if the future trajectory of immigration remains mostly unaltered.
Money supply growth
We can already see the money supply accelerating in several countries, with 10% to 15% growth in the U.S. (see next chart).
U.S. money supply growth has been rising

Note: As of March 2020. Source: Haver Analytics, RBC GAM
Does this herald higher inflation? In an earlier #MacroMemo, we acknowledged the risk of somewhat higher inflation over the long run in response to large central bank balance sheets, high public debt loads and de-globalization. But we are doubtful this inflation will show up right away. To the contrary, inflation is actively falling in the short run.
There is a theoretical linkage between an accelerating money supply and inflation. But in practice the periods with the fastest money supply growth are recessions and crises, when inflation is low. This is for a few reasons. Some people and businesses become scared and sell a fraction of their fixed assets or investments, putting the proceeds into chequing accounts and other liquid instruments that are part of the definition of “money.” Furthermore, companies sometimes draw on their credit lines, not because they need the funds, but as a precautionary exercise to ensure sufficient money to cover for any further surprises. This also adds to the money supply. Finally, central banks tend to print money during periods of economic contraction, adding to the money supply.
But none of this is inflationary in the short run because as much as the money supply goes up, the velocity of money goes down because economic activity slows. In turn, inflation rarely appears. Furthermore, all of these actions that boost the supply of money are ultimately temporary, and unwind as conditions return to normal.
The money supply spike through March is smaller than that experienced in 2009 or in 2012. Even if April data points an even larger increase, neither of the prior experiences created any lasting inflation, and this money supply spike probably isn’t as exciting or consequential as it first looks.
-With contributions from Vivien Lee and Graeme Saunders
Interested in more insights from Eric Lascelles and other RBC GAM thought leaders? Read more insights now.