Global Investment Outlook
Our latest quarterly Global Investment Outlook has now been released, providing a wide-ranging assessment of financial market conditions and the path ahead.
The economic article is entitled “Consumer revival awakens inflation fears”.
Overview
This week’s note covers the latest infection, reopening and vaccine figures, and includes a further discussion of the Delta variant. We then share our latest economic forecasts, review key economic trends including a dip in news sentiment and a revival in hotel occupancy. The Fed’s latest missives are then dissected, followed by a further update on inflation and a new perspective on post-pandemic themes.
Recent developments remain a mix of positives and negatives.
Negatives include:
- The Delta variant continues to push U.K. infections higher. It is also multiplying beneath the surface in other markets, including Canada.
- Emerging market infections are no longer falling as readily as before, with some countries now turning higher.
- The latest U.S. inflation reading exceeded expectations yet again.
- Our revised economic growth forecasts are no longer materially above the consensus.
Conversely, positives include:
- The global infection count continues to decline, especially among developed nations.
- While the Delta variant is more contagious, damaging and better at evading vaccines, it appears that even a single inoculation significantly reduces the likelihood of a severe case requiring hospitalization.
- The Fed emitted a more hawkish message. This could be construed as a negative to the extent that risk assets frequently relish low interest rates. However, it is even more important that central bankers not make a policy mistake – in this case, leaving rates too low even as inflation has revived and the economic recovery progresses.
- Especially in the developed world, economic restrictions continue to ease and economies are accelerating.
Infection improvement slows
The world continues to record a declining number of new COVID-19 infections per day (see next chart). However, the rate of improvement recently slowed, potentially reflecting the spread of the Delta variant first identified in India.
Global COVID-19 cases and deaths

As of 06/20/2021. 7-day moving average of daily new cases and new deaths. Source: WHO (World Health Organization), Macrobond, RBC GAM
The deceleration is particularly apparent among emerging market (EM) nations (see next chart). This arguably makes sense given that EM countries have received fewer vaccines per capita. Quite a number of EM nations have high and/or rising daily infections. These include many South American countries, including Columbia, Brazil, Chile and Peru. Elsewhere in the world, South Africa and Russia are also recording rising infections.
COVID-19 emerging market vs. developed market infections

As of 06/20/2021. Calculated as the 7-day moving average of daily infections. Source: WHO, Macrobond, RBC GAM
Whereas China was recently experiencing its highest infection rate since early in 2020, it has now seemingly turned the corner. We have a high level of confidence in its ability to control the pandemic. Europe’s infection rate is also declining.
Happily, U.S. cases continue to fall -- despite that country having among the fewest social distancing restrictions and possessing a diminishing vaccination advantage (see next chart). The U.S. now records its fewest new cases since the pandemic began.
COVID-19 cases and deaths in the U.S.

As of 06/20/2021. 7-day moving average of daily new cases and new deaths. Source: WHO, Macrobond, RBC GAM
Delta variant
However, not all developed countries remain on the mend. U.K. infections continue to rise, and are no longer trivial in number: the country now has more than 10,000 new infections per day (see next chart).
COVID-19 cases and deaths in the U.K.

As of 06/20/2021. 7-day moving average of daily new cases and new deaths. Source: WHO, Macrobond, RBC GAM
The cause of this surge is clear: the Delta variant has almost entirely taken over (see next chart).
COVID-19 variant share of cases in U.K.

As of 06/20/2021. Share of cases by variant. Source: GISAID, RBC GAM
It is initially surprising that the U.K. is struggling, given that it is among the world’s vaccination leaders and had fairly strict restrictions into the spring. It could simply be that the U.K. had the bad luck to accumulate a critical mass of Delta variant cases first, with other developed countries set to experience something similar over the next few months.
Alternately, the U.K. may have been specifically vulnerable in a few ways:
- A sizeable share of its population received the AstraZeneca vaccine, which appears to be somewhat less effective against the variant.
- English residents under the age of 30 only became eligible for vaccination on June 7, so a concentrated and highly social fraction of the country’s population was largely unvaccinated until quite recently.
- The Delta variant also took hold in parts of the country with lower vaccination rates than the rest, such as Bolton. That shortfall has since been remedied, and Bolton is now recording a declining number of new cases per day.
- The U.K. has reported that the large majority of people hospitalized with the Delta variant were unvaccinated.
If the U.K. is truly special in these regards, perhaps other countries will be spared a further wave of infections. It is nevertheless ominous that the Delta variant appears to be expanding in many developed countries, including Canada. Our calculations argue that it is rapidly spreading even as the Alpha (British) variant is receding (see next table).
Delta variant rises in Canada
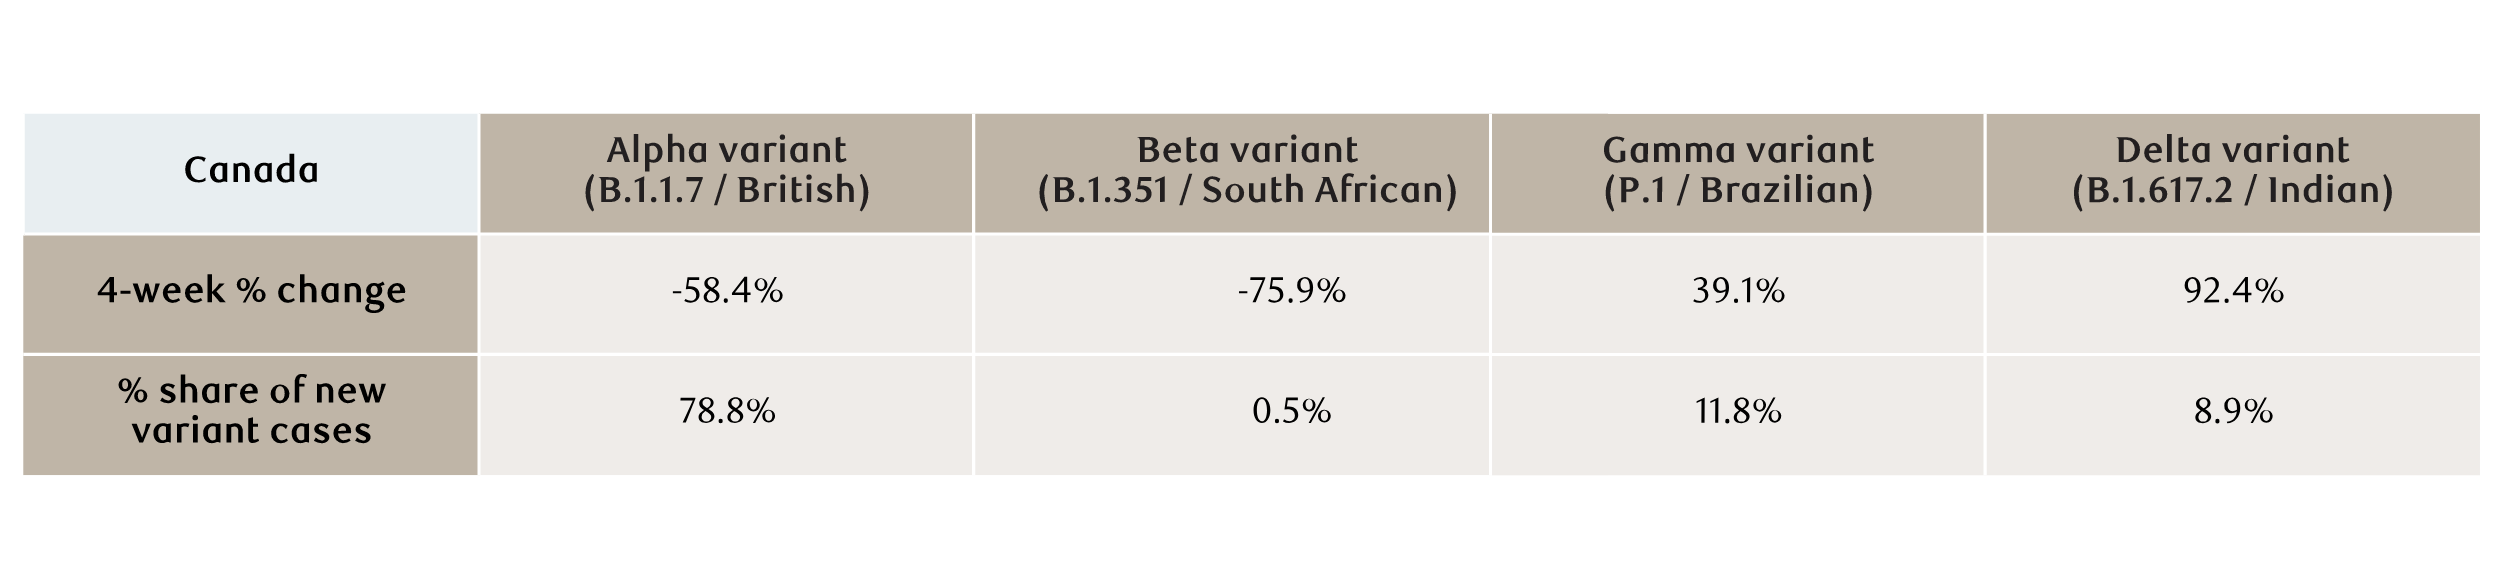
As of 06/18/2021. Government of Canada, RBC GAM
So, while Canada’s overall infection rate has fallen below 1,000 new transmissions per day (see next chart), there is a risk that it begins to reverse course should the vaccination campaign not deliver second shots quickly enough.
COVID-19 cases and deaths in Canada

As of 06/20/2021. 7-day moving average of daily new cases and new deaths. Source: WHO, Macrobond, RBC GAM
Despite the Delta variant’s ominously high reproduction rate (60% higher than the next most contagious variant), tentatively higher hospitalization and fatality rate, and ability to infect partially inoculated people, there is some recent good news. Analysis by The Financial Times finds that even a single dose of vaccine is around 70% effective at preventing hospitalization. In other words, while partial vaccination may only be 33% effective at stopping someone from being infected, it is fairly effective at preventing them from becoming dangerously sick.
Given that the current level of restrictions is seemingly insufficient to limit the Delta variant, and furthermore that herd immunity is not attainable until children can be vaccinated (and may be elusive even then), it seems likely that there will be another wave of the virus. However, much as the fatality rate failed to spike during the third wave, both the hospitalization and fatality rate may remain fairly low during the fourth wave. To the extent that public policy has been set in significant part based on hospital capacity, this argues governments either won’t lock down or will only impose mildly stricter rules.
In turn, economic damage should be minimized. We’ve budgeted for a very small amount of economic damage over the latter half of the summer, but nothing more.
A tricky problem that remains is elementary schools. Until younger children can be inoculated, elementary schools will be a breeding ground for the Delta variant. Barring rapid approval of vaccines for younger children, it may be problematic to open elementary schools in the fall, at least without significant safety precautions.
Reopening
At the global level, government restrictions have actually begun to tighten slightly (see next chart – up is stricter). We suspect this primarily reflects emerging market nations imposing stricter rules as their infection rates begin to rise, because most developed-world countries have been enthusiastically reopening (see subsequent chart – up is looser).
Global Stringency Index

As of 06/20/2021. Global Stringency Index measuring the strictness of lockdown policies that restrict mobility, calculated as stringency index of 50 largest economies. Sources: University of Oxford, International Monetary Fund (IMF), Macrobond, RBC GAM
Severity of lockdown varies by country

Based on latest data available as of 06/17/2021. Deviation from baseline, normalised to U.S. and smoothed with a 7-day moving average. Source: Google, University of Oxford, Macrobond, RBC GAM
Canada remains the most locked down of the examined countries, though it is beginning to ease up. We note that every region of the country has eased its restrictions somewhat, though Ontario has done this the least and remains by far the most locked-down jurisdiction (see next chart – down is looser).
COVID restrictions now easing again

As of 06/09/2021. Atlantic region includes New Brunswick, Newfoundland and Labrador, Nova Scotia and Prince Edward Island; Prairies region includes Alberta, Manitoba and Saskatchewan. Source: Bank of Canada, RBC GAM
Reflecting these reopening efforts, Canadian businesses have begun to report being more open as of early June (see next chart). This is a sign that the economy is starting to rebound after a difficult April and May.
Canadian businesses shuttered again during third wave

As of 06/07/2021. Source: Canadian Federation of Independent Business (CFIB), RBC GAM
Vaccines
The focus for developed countries is increasingly pivoting from delivering first doses to delivering second doses. This is in part because a significant fraction of populations have already received their first dose, but also because the Delta variant appears to require a second dose for adequate protection.
Globally, over 2.6 billion shots have now been administered, or 34 doses for every 100 people. The effort is now running at an admirable clip of 39.7 million new doses each day.
The leaderboard remains familiar (see next table). The United Arab Emirates, Israel and Bahrain are at the top. The U.K. and U.S. lead among large nations, though the U.K. is now substantially ahead of the U.S. Canada now nips on the heels of the U.S., with 85 doses per 100 people, versus 95 in the U.S. Remarkably, Canada is now vaccinating four times more quickly than the U.S. on a per capita basis, trailing only China in its population-adjusted pace.
COVID-19 global vaccination ranking

As of 06/20/2021. Cumulative total doses administered by country per 100 people. Source: Our World in Data, Macrobond, RBC GAM
Vaccine hesitancy
U.S. vaccine hesitancy is becoming a real issue. Despite an ample supply of vaccines, just over half of all Americans have now received a dose (53%). Betting markets have become more pessimistic and are now highly skeptical that the U.S. will manage to fully vaccinate 80% of its population by next spring (just a 13% chance), let alone the 90%-plus rate that would be necessary for herd immunity against the Delta variant.
Some U.S. states are faring well, with Vermont now boasting that 73% of its population has at least one dose and 63% of its population has two. Others, such as Mississippi, are doing less than half as well. Just 35% of the Mississippi population has one dose and only 29% have two doses.
While Mississippi reports more cases on a per capita basis than Vermont, both are fairly low and neither is actively rising. It is unclear whether this is because warmer weather is holding the virus at bay, because Mississippi has a higher level of natural immunity due to earlier infections, or if some other consideration is at work. On the surface, Mississippi and states like it would appear quite exposed to the Delta variant.
Although the country got a late start, Canada has now well surpassed the U.S. in terms of people who have been at least partially vaccinated (67% of the population). In fact, by this metric, Canada comes second in the world only to Malta. However, this is in significant part a function of Canada’s decision to pursue a first dose strategy, trying to get as many people partially protected as possible in the early going, and delaying second doses. As a result, 45% of the U.S. population is fully inoculated versus just 18% of Canadians. But Canada is turning the corner on this front in June, and appears to have significantly less vaccine hesitancy to deal with than the U.S.
Other vaccine developments
The U.S. has now promised 500 million doses of spare vaccines for friendly countries. The country is swimming in surplus doses and has an opportunity to engage in more vaccine diplomacy.
Novavax has just announced the results of its Phase Three trials, with a high 93% efficacy against COVID-19 variants. While this slightly trails the Pfizer and Moderna results, those were not tested as extensively against the most modern and virulent variants. As such, it appears to be as good as any of the existing vaccines. Countries must now grant emergency use authorization.
The Novavax vaccine is constructed differently than the mRNA vaccines or the AstraZeneca vaccine. It is a “protein subunit” vaccine, using the same techniques as those used for the annual flu vaccine. It is the company’s first successful vaccine.
Novavax reports that it plans to produce 100 million doses per month by the end of the third quarter of 2021, increasing this to 150 million per month by the fourth quarter. It lacks significant manufacturing capacity of its own, meaning it is relying on third-party manufacturers.
Updated forecasts released
New economic forecasts are contained within the latest Global Investment Outlook. These are not as reliably above consensus as they were over the prior several quarters (see next table). We are now, for instance, technically now below the consensus for the U.S. despite a gargantuan and upgraded 2021 GDP growth forecast of +6.4%. Similarly, we are now merely on-consensus for Canada with an upgraded +6.1% forecast.
RBC GAM GDP forecast revisions
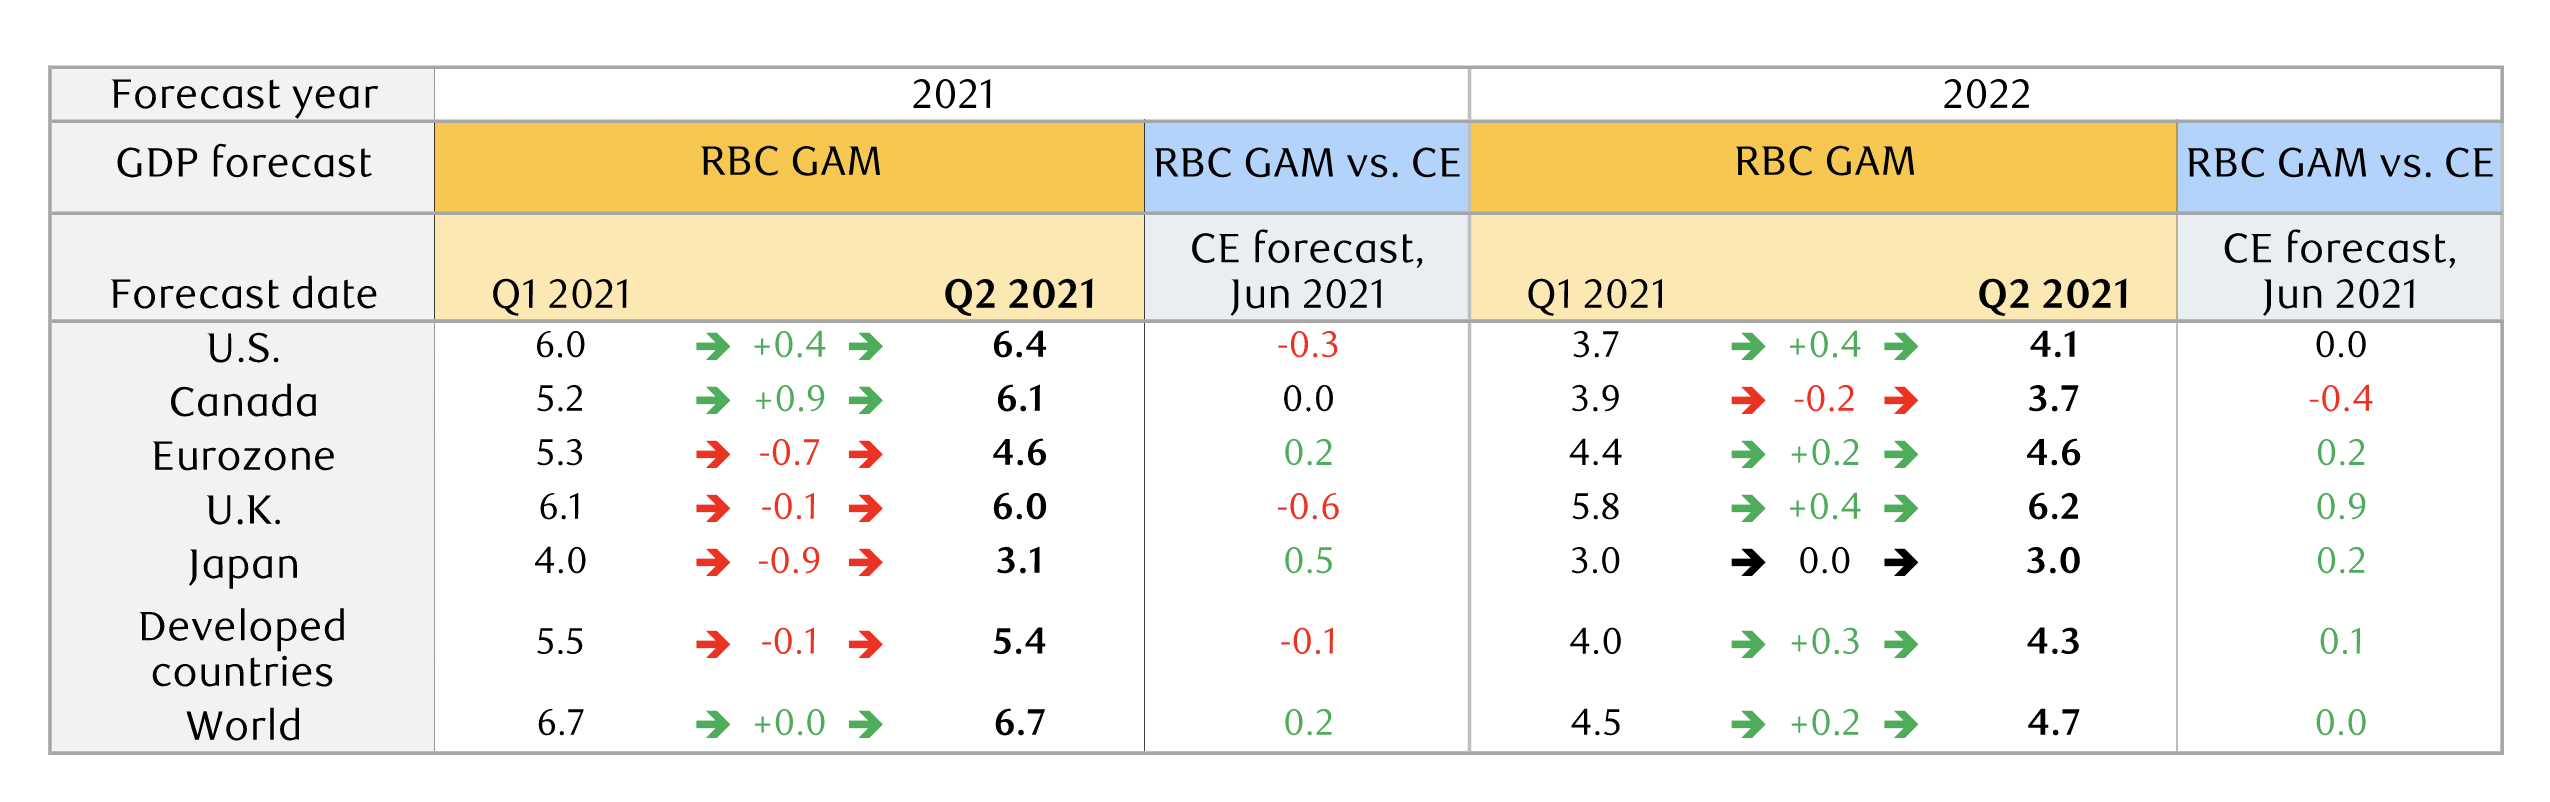
RBC GAM forecast as of 05/27/2021. RBC GAM vs. CE calculated as RBC GAM forecast minus Consensus Economics (CE) forecast. Developed countries include U.S., Canada, Eurozone, U.K. and Japan. World includes developed countries aforementioned. China, India, South Korea, Brazil, Mexico and Russia. May 2021 CE forecasts for Brazil, Mexico and Russia used to estimate June 2021 world GDP forecast. Source: CE, RBC GAM
After a year in which the winning bet was almost always above the consensus, it seems to us that the pendulum has begun to swing back at least partially in the other direction. Economic surprises have become less reliably positive in recent months and a great deal is now already priced into forecasts (and financial markets).
In turn, all else equal, one might expect less extravagant returns from risk assets over the coming year relative to the last year.
Economic developments
News sentiment turns?
The U.S. Daily News Sentiment Index recently slipped (see next chart). It is still quite strong on an absolute basis, but this nevertheless represents the most notable decline since the initial wave of the pandemic last year.
Daily News Sentiment Index in the time of COVID-19

As of 06/06/2021. Source: Federal Reserve Bank of San Francisco, Macrobond, RBC GAM
It could be that this latest movement merely constitutes noise. But it could also represent a shift from a phase when economic data was nearly always better than expected, when vaccines were reaching U.S. arms at a record rate and policymakers were lifting restrictions, to one in which there are several limiting factors:
- The economic data remains good but not surprisingly so.
- The U.S. rate of inoculation has slowed by more than half.
- There are new concerns about the Delta variant.
- Inflation is now a worry.
- The U.S. Federal Reserve is now thinking of tightening monetary policy.
Hungry for forbidden fruit
The debate between whether economies would be held back by economic scarring or propelled forward by pent-up demand is currently being won by the “pent-up demand” camp.
People appear to be quite eager to do the things that were previously restricted. For example, the U.S. hotel occupancy rate is now higher than it was before the pandemic (see next chart). It should be conceded that seasonal factors likely explain some of this. But the current upward momentum and the onset of vacation season argue that hotel occupancy may yet rise significantly further, eliminating any doubt.
U.S. hotel occupancy resumes its ascent

For the week ending 06/12/2021. Source: STR, Wall Street Journal, RBC GAM
Canadian developments
Although Canada was locked down until recently, there is also evidence of consumers pivoting toward previously depressed sectors. For instance, Canadian travel spending has recovered from being 86% below 2019 levels at its worst to just 56% below normal now. Canadian hospitality spending has similarly revived from -62% to -40%.
Even with the flash estimate that Canadian GDP shrank in April and our expectation that it was roughly flat in May, second-quarter GDP is nevertheless on track to eke out a slightly positive reading. This is welcome, if it holds.
On a related note, we estimate the Canadian economy was less than 2% away from its peak at the end of May. This means that around 90% of the pandemic’s economic decline (GDP fell by 18% at its worst) has since been unwound. It is likely just a matter of months before the economy is setting new records (though a further year before the economy is back to its full potential).
While of little ultimate relevance, it is interesting to note that Canadian nominal GDP is already significantly higher than it was before the pandemic. Of course, that just means that prices are considerably higher than before the pandemic, even though the amount of stuff produced is still lower.
Bank of Canada sticks to its guns
The Bank of Canada stuck to its guns in its latest rate decision. It reiterated that high inflation is temporary despite the latest Canadian 3.4% year-over-year (YoY) Consumer Price Index (CPI) reading. The Bank also argued that the economy has evolved in line with its expectations (despite a bit more weakness than was arguably anticipated in April).
The central bank continues to see “considerable excess capacity” and maintains its forecast that economic slack should be gone in the second half of 2022. In turn, that appears to be the most logical moment for Canada’s policy rate to begin rising. The rate of quantitative easing has already slowed by a quarter, and seems likely to continue decelerating over the coming quarters.
More hawkish Federal Reserve
The latest decision by the U.S. Federal Reserve, in contrast, pivoted in a clearly more hawkish direction. In fairness, the central bank had been so dovish previously that this was almost inevitable.
The Fed acknowledged that inflation had risen, though identified the bulk of the increase as being of a transitory nature. It similarly acknowledged that the economy has strengthened further. Reflecting all of this, the Fed upgraded its GDP forecast for 2021 from 6.5% to 7.0% (note that this is a Q4/Q4 formulation, rendering it imperfectly comparable to our own forecasts discussed earlier). It now expects the unemployment rate to be just 4.5% by the end of the year, not far from “full employment”.
Most tellingly, the Fed upgraded its inflation forecast from 2.4% to 3.4% for the end of 2021. As such, while it doesn’t expect most of the inflation pressures to stick around indefinitely, neither does it expect them to vanish altogether over the next few months. But the Fed’s inflation forecast for 2022 and 2023 are then only 0.1ppt higher than before, at 2.1% and 2.2%. Our own outer year forecasts are a bit more than this, in the 2.5% range. Reflecting the risk that the Fed’s inflation forecast may indeed be too low, 13 of 18 Fed participants acknowledge that the risk to their inflation forecast is more to the upside than the downside.
The key question was how Fed participants would adjust their projections for the fed funds rate given all of this? The median projection is now for two 25bps rate hikes in 2023, up from none until 2024 as projected last quarter. Thirteen of 18 participants now expect a rate increase in 2023, up from 7 participants in March.
While the median forecast does not foresee a policy rate increase in 2022, this is only barely. Seven of 18 participants now expect a rate hike that year, up from just four in March.
For their part, financial markets have been ahead of the Fed for some time. Nevertheless, they upgraded their expectations in response to the latest announcement. Prior to the meeting, the market priced in a 70% chance of a 25bps rate hike by the end of 2022; after the meeting, the market fully expects this hike.
The Fed gave no clear indication of when quantitative easing would abate, reiterating its now familiar promise to maintain the current pace until “substantial further progress” is made to the goals of maximum employment and price stability. To the extent that the inflation goal has already arguably been met and the employment goal might be achieved by early next year, it seems reasonable to expect bond buying to begin abating sometime this fall. But, in all fairness, it can’t be said that the Fed conveyed this explicitly. The Minutes that trail this meeting will likely reveal more.
Technically, the Fed has already begun unwinding certain aspects of its extraordinary stimulus. This was evidenced by the commencement of sale operations last week to dispose of $8 billion in credit ETFs.
Overall, it appears the Fed is taking more seriously the robust U.S. economic recovery and the risk of sustained inflation. This is arguably a good thing to the extent it prevents the U.S. economy from overheating prematurely, even though it simultaneously applies a mild handbrake to the economy and risk assets in the form of higher borrowing costs.
More on inflation
Inflation remains front of mind as an economic and investment risk, and so we continue to update our thinking in nearly every #MacroMemo. Our broad thesis remains that inflation should be very high over the next few months, moderately high over the next few years, and then no more than normal over the long run.
U.S. CPI for May was released, and surprised to the upside yet again, reaching a lofty +5.0%. This is the highest reading since 2008, when the last gasps of a commodity supercycle temporarily charged inflation beyond that point.
This reading is probably about as high as U.S. inflation gets. The base effects now begin to work in the opposite direction – meaning that prices would have to rise quite a lot in June and July simply to maintain the same annual reading since large price jumps from last June and July will be falling out of the equation. All the same, given the heady monthly increases in recent months and ongoing supply pinches, we are less confident than before that the inflation reading will ease significantly over that time. It will probably remain near 5% over the next few months, before settling down into the autumn.
Shipping costs
Shipping costs have been a much-cited reason for high inflation. This is a valid excuse: the Drewry World Container Index shows an extraordinary quintupling in the cost of shipping by sea over the past year (see next chart). Perhaps unsurprisingly, the cost of shipping has increased particularly extravagantly for products sourced from China given that China produces many of the goods that locked-down consumers want.
Shipping costs soared during the pandemic

As of the week ended 06/17/2021. Source: Drewry Supply Chain Advisors, RBC GAM
So far, there is no evidence that shipping costs have peaked. We will be watching this chart closely for any change.
Inflation in emerging markets
As is almost always the case, emerging markets are being affected by rising inflation even more so than developed countries. Case in point, Indian inflation is now +13% YoY and Brazilian inflation is now +8% YoY.
This makes sense for several reasons:
- Emerging market (EM) countries tend to have less anchored inflation expectations. This means that a temporary deviation can bring more lasting consequences.
- The basket of spending in EM countries tends to be more focused on essentials like food and fuel – categories that have experienced significant jumps.
- EM central banks cannot tolerate high inflation for long as it can spur capital flight by foreign investors.
As such, some EM central banks have now had to raise their policy rates, including Russia, Brazil and Turkey. This then undermines their economic recovery.
On the other hand
However, there are several other developments that argue the inflation threat has recently dimmed slightly. These include the earlier observation that the U.S. Federal Reserve has now seemingly awakened to the threat, and is planning a less dovish course forward. China is also positioning itself against further strong inflation.
Bond market unconcerned
The bond market has become, if anything, less concerned about the threat of high inflation over the past few months, even as inflation itself has risen.
One example of this is that the U.S. nominal 10-year yield has fallen from 1.74% at the end of March to just 1.48% today. This would not be the logical direction if inflation were expected to advance significantly further, or to remain high for any sustained period of time.
Similarly, the U.S. 5-year breakeven – a proxy for inflation expectations – has diminished from 2.77% in mid-May to 2.42% today. This still isn’t low, but again reflects diminishing rather than escalating inflation concerns.
Commodity supercycle
While oil prices have advanced further – West Texas oil is now at $71/barrel – it isn’t clear that a long bull market lies ahead. After all, demand remains below normal and is unlikely to fully revive in a world of virtual working and limited international travel; OPEC maintains significant idled production capacity; U.S. shale oil stands ready to capitalize on higher prices; and, over the long run, oil demand is expected to peak in just over a decade.
Meanwhile, although there are reasonable arguments that might support a base metals boom, the reality is that iron ore prices have fallen by 14% since early May. Copper prices are down by 13% over the same time period.
None of this is a guarantee that commodity prices are sustainably peaking, but, for the moment, they have actually come down somewhat. This should take some pressure off inflation.
Alternate core inflation measures
It is interesting that certain alternate measures of core inflation find a much less heated inflation environment. For instance:
- U.S. trimmed mean inflation is currently at just +1.8% YoY.
- U.S. median inflation is only +2.1% YoY.
This contrasts to the official ex-food and energy core CPI reading of +3.8% YoY.
This isn’t to say that the alternate measures are better (though the Bank of Canada thinks they are, having abandoned fixed-exclusion indices some time ago). Instead, it says something about the nature of inflation today. Both of the alternate measures essentially filter out the products with the most extreme price increases and decreases. What they find is that the average product isn’t experiencing particularly notable inflation.
Instead, what is happening is that a lot of products are experiencing roughly normal inflation, while a handful of items are recording gargantuan increases. These big gainers still affect the cost of living, and so can’t be discounted. But it tells us that high inflation is not a universal phenomenon right now. Instead, it reflects specific problems arising in a handful of sectors.
Real-time
As discussed in an earlier #MacroMemo, consumer prices scraped from the web in real-time continue to argue that inflation peaked perhaps a month ago and is now beginning to abate slightly. This also promising.
Post-pandemic trends
Our general thesis with regard to what the world will look like after the pandemic ends is that only a handful of things will be permanently altered, such as the amount of public debt and the number of hours spent in the office. Most elements of life will snap back to normal over the next few years.
Nevertheless, a recent Economic Magazine article does an admirable job of investigating past pandemics, crises and wars, sussing out how life changed afterwards:
- Economies generally bounce back fairly quickly after a crisis. Despite this, the 1920s weren’t quite as roaring as commonly imagined after the Spanish Flu – they were fairly ordinary by many metrics.
- It is normal for savings rates to be high during a crisis, as they have been during this pandemic.
- Not all of the savings get immediately spent after the crisis. For instance, American consumers only spent about 20% of the excess savings they’d accumulated during World War II over the subsequent four years.
- It isn’t clear that any euphoria will last for long: beer consumption actually fell after the end of World War II, rather than increased.
- Pandemics such as the Black Death unleashed a higher level of risk-taking afterward, with more people venturing to the New World at that time. New business formation boomed in 1919 after the Spanish Flu, much as it is elevated now. We already expect faster productivity growth in the future.
- Of further relevance to productivity, pandemics accelerate automation. The 1920s, for instance, saw the automation of the telephone network. Today, businesses that could not place workers in close proximity last year and that cannot find enough people to hire this year are similarly turning to automation.
- The post-pandemic experience may also create a more pro-worker attitude. Public debt and inflation is no longer the priority – helping people is. Some of this may endure.
- A recent IMF report finds that political unrest often increases after a pandemic, with social unrest peaking around two years afterwards.
Not all of these factors will prove relevant over the coming years. Most are themselves ultimately temporary (if of a multi-year nature), but some could prove important.
-With contributions from Vivien Lee and Lucas Hervato
Interested in more insights from Eric Lascelles and other RBC GAM thought leaders? Read more insights now.