Economic webcast:
- Tune into our monthly economic webcast, entitled “Interpreting monetary stimulus”.
Business cycle update:
- Recent financial market distress reflects overlapping concerns about slowing global growth, an aging business cycle and rising protectionism.
Slowing growth
- Worries about growth became more intense over the past week as the U.S. ISM (Institute for Supply Management) Manufacturing and Non-Manufacturing indices both fell despite expectations for a rebound. We had previously argued that while the manufacturing sector is taking the brunt of the pain, other sectors are holding up better. There is still some truth to this. Consumers, in particular, remain resilient. But service sector metrics are undeniably also weakening.
- We tackle the second of these topics – the business cycle – below. We’ll explore the third – protectionism – in the following section.
U.S. business cycle
- We have long argued that the U.S. business cycle is at a late stage, as informed by our scorecard approach. The most recent update – conducted this week – reveals a further push forward, at the margin (see first chart below). While “late cycle” is still the most likely diagnosis, eight of the underlying 17 inputs argue that the cycle has at least inched forward, versus just two that make the opposite case.
-
U.S. is “late cycle,” with strengthening “end of cycle” claims
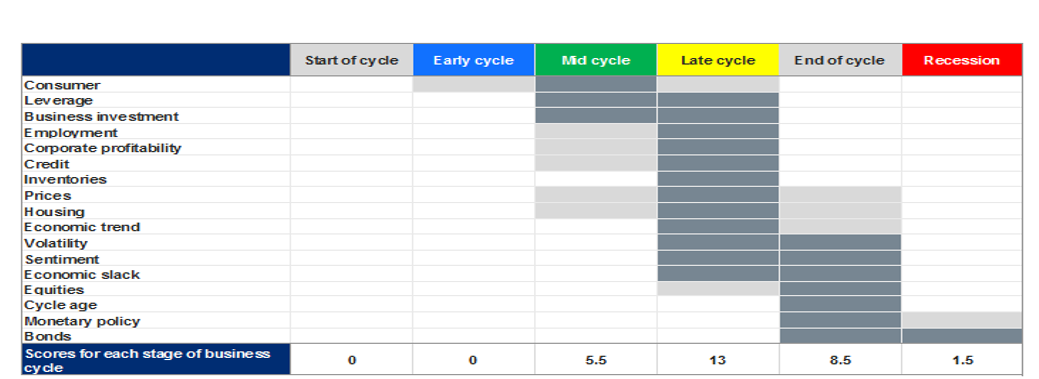
Note: As at 8/8/2019. Dark shading indicates the most likely stage of business cycle (full weight); light shading indicates alternative interpretation (0.5 weight). Source: RBC GAM
- With regard to counterclaims, “End of cycle” is now substantially more plausible than “Mid cycle”, and “Recession” even receives a few votes from the Monetary policy and Bonds inputs, reflecting the fact that central bank rate cutting, inverted yield curves and bond yields plummeting to low levels (the U.S. 10-year yield recently touched an intraday reading of just 1.59%, having approximately halved in just nine months) have historically been associated with the arrival of recession.
- Various recession models acknowledge a rising risk over the next year (now 31% as per the NY Fed), though none assign a probability over 50% (see next chart).
-
U.S. recession probability in one year via yield curve: has risen significantly
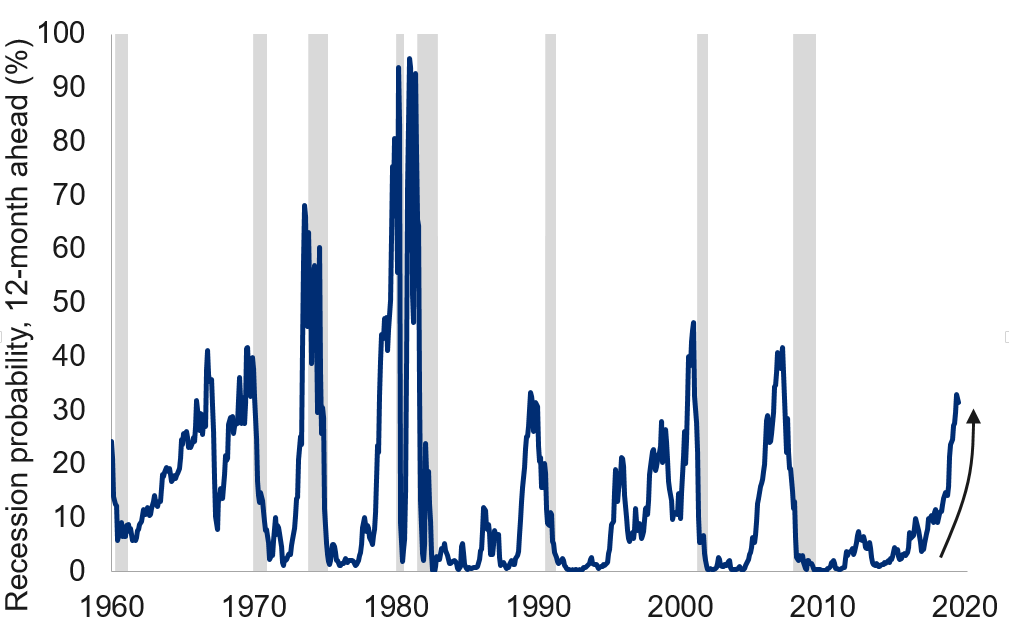
Note: As of Jul 2019. Probabilities of a recession twelve months ahead estimated using the difference between 10-year and 3-month Treasury yields. Shaded area represents recession. Source: Federal Reserve Bank of New York, Haver Analytics, RBC GAM
- To be fair, fully half of the eight advancing inputs in our scorecard were “high twitch” measures. They predict doom whenever the stock market falls, bond yields drop and volatility rises, but just as quickly predict a long cycle ahead whenever markets rise. Unavoidably, these measures make many false claims over the span of the cycle, but do reliably drop in the lead-up to the real thing. It is never clear until after the fact which was which. Furthermore, the scorecard notes that:
- the U.S. consumer doesn’t seem particularly stretched
- S. leverage is not egregious
- housing is not especially problematic.
- For investors, these signals – while imprecise – continue to advocate for a bit less risk-taking than at earlier points in the cycle. Complicating the optimal response, while financial market valuations can hardly be said to be compelling in either stocks or bonds, stocks are more attractively priced on a relative basis. Thus, investors must juggle the risk of poor equity returns in the short run against the promise of superior equity returns over the medium and long run. And, as we wrote in mid-July, there are ways in which this cycle could keep chugging along, if:
- there ultimately proves to be more economic slack than popularly imagined
- the inverted yield curve proves to be a distorted signal as many argue, and/or
- we see a lack of major financial market excesses to trigger a downturn.
- Alas, there is little that is sure fire when it comes to predicting economies or markets.
U.S.-China protectionism:
- The U.S. protectionism drum has resonated loudly over the past year, with a clear tendency toward deteriorating relations rather than ameliorating ones, and with a particular focus on China.
- The U.S. ratcheted the pressure higher in May with a new round of Chinese tariffs, then uncharacteristically allowed some of the pressure to escape in June/July with a so-called “truce.” The tariff story has reverted to trend recently with President Trump’s announcement of a 10% tariff starting on September 1st on the remaining $325B of Chinese products exported to the U.S.
- On a more minor note, the U.S. has also now levied a tax of as much as 229% on Chinese wooden cabinets to offset what it says are Chinese subsidies of the sector. This will affect just $4.4B of imported goods.
- This major expansion of tariffs had long been threatened, and the White House could eventually increase the tariff rate on the $325B in products from 10% to 25%, as it has previously threatened.
- The motivation for this latest round of tariffs appears to be a mix of ongoing annoyance about China’s unwillingness to alter its economic structure to create a more level economic playing field, plus the view that China has failed to import more U.S. agricultural products as it had promised in June/July.
- This next tariff hits essentially everything that the U.S. had strategically opted to avoid in previous rounds. As a result:
- a) the incremental pain to the U.S. economy is likely to be somewhat greater
- b) the impact on consumers may be more direct than prior rounds that had focused disproportionately on intermediate goods
- c) the incremental hit to the Chinese economy may be less intense as the prior round of tariffs had already targeted the country’s most vulnerable sectors.
- If delivered and sustained, the new tariffs and the Chinese response should cumulatively subtract around 0.2% from each country’s economic growth over the next few years. This puts our base-case cumulative U.S. GDP damage up to 0.5% to 0.8%, and Chinese GDP damage up to 0.6% to 1.0%.
- The net negative impact to the Chinese economy is still greater than to the U.S. This is in significant part because China is struggling to respond symmetrically with tariffs of its own given that the U.S. exports far less to China than the reverse. The Chinese response in May fell well short of a full counterpunch for this reason. This time, China has opted to halt all agricultural imports from the U.S. That is a move of both political and economic significance to the U.S. However, the U.S. government reliably bails out the agricultural sector when events like this arise, so sector-specific suffering should be contained. Furthermore, the short-run elasticity of food supply is quite low since it takes time to grow a harvest or rear an animal, and the (short- and long-run) elasticity of demand for food is also fairly low since people need to eat. So a shift in Chinese agricultural imports should open up a hole elsewhere in the world for the U.S. to fill.
- As we have noted in the past, a great deal of the protectionist spat is playing out via non-tariff measures. The latest example of this is the recent depreciation of China’s currency past the symbolic 7 threshold. Normally, China’s capital controls, combined with reserve management transactions, keep the currency bound to a narrow range. Thus, the larger move is widely viewed as a Chinese counterpunch against recent U.S. trade actions. However, beyond the signal it sends, too much should not be made of the move for these four reasons:
- The movement is still tiny in the grand scheme: even after including the earlier depreciation of the renminbi in May, China’s currency is only 3.4% weaker than a year ago and just 5.5% weaker than its annual high. In comparison, there is little international fuss about the 5.1% appreciation of the yen over the past year, or the 7.7% depreciation of the Australian dollar.
- China’s currency is not egregiously mispriced once one applies a proper emerging market model.
- It makes sense that the renminbi is weaker at a time of U.S.-initiated tariffs. This is the classic currency response to protectionism.
- China suffers as much as it benefits from a weaker currency. It has long struggled to manage capital outflows, and this recent weakness could revive such forces. Furthermore, there is little short-term economic advantage from a weaker exchange rate. The first effect is usually more inflation, with trade gains coming only much later.
- Unsurprisingly, the U.S. responded to the weaker renminbi by labelling China a currency manipulator. If anything, it is surprising that the White House had refrained from applying this tag earlier.
- The countries are expected to engage in more serious trade negotiations in September, but major progress seems unlikely. While economic damage is unfortunate, China is simply unwilling to modify its economic structure in the ways that the U.S. demands, the U.S. seems unlikely to back down, and both countries enjoy a political boost from the resultant nationalism. This calculus could yet change if the economic damage becomes more visible and as the 2020 U.S. election nears, but that is not certain.
- Our base-case scenario now assumes that the new trade measures will stick, and highlights the possibility of a modest further increase in tariffs. However, we do not budget for the application of a 25% tariff rate on the $325B of Chinese products. We also do not expect a major auto tariff in the fall. These represent downside risks to growth and markets.
Fed review:
- It now feels like ancient history given all that has happened over the past few weeks, but the July 31 decision to cut interest rates by the U.S. Federal Reserve is still highly relevant, and worthy of further contemplation.
- Central bank stimulus appears to be the central force for good (or at least growth), pitted in a battle against weakening economies and rising protectionism.
- To be sure, the U.S. is not alone in its recent action. India, New Zealand and Thailand have all cut rates over just the past week. They are hardly alone given earlier easing from other heavyweights like China and the promise of stimulus from the European Central Bank in the near future. But U.S. interest rates and monetary policy play an outsized role on the world stage, and so merit special attention.
- Despite the 25bps rate cut to a level of 2.125%, the Fed decision was deemed surprisingly hawkish by the market. Why? Reasons include:
- The market had priced in a sliver of a 50bps cut that went unrequited.
- Two out of 10 Fed voters dissented against easing.
- The Fed emphasized its data dependency (with the implication that further rate cuts are not automatic).
- Chair Powell made reference to a “mid-cycle adjustment in policy” that suggested the Fed thought no more than a few rate cuts would be necessary before growth reaccelerates.
- In fairness, it was not entirely one-sided as the Fed also announced that its quantitative tightening operations would come to a halt a full two months early (as of August rather than October). Powell emphasized in the press conference that a mid-cycle adjustment didn’t mean just one cut.
- Market expectations initially ratcheted back the amount of easing anticipated. However, the recent application of additional tariffs by the White House and the related swoon in risk assets have since convinced the market that even more monetary stimulus will be necessary and also forthcoming. Having priced in just an 8% chance of three further rate hikes by the end of 2019 immediately after the FOMC decision, the market now puts this at a nearly 50% chance as of August 9.
- While the Fed may struggle to fully deliver on market expectations, it is clear that much of the decline in bond yields over the past year has been appropriate. Monetary policy has pivoted.
- Has the Fed fallen into the trap of becoming beholden to U.S. trade policy? To an extent, yes, in that protectionism figured centrally in the initial rate cut, and President Trump now likely feels more emboldened to apply further protectionism. But this is largely unavoidable – the Fed’s job is to steady inflation and growth, regardless of whether the turbulence comes from organic factors or policy decisions.
- Our nervousness around monetary stimulus relates to several considerations. While rate cuts do mathematically add to growth, the boost is only moderate. In a worst-case scenario they can cause an economy to overheat sooner than it would have, and the very act of cutting rates is associated more often than not with an approaching recession. This is a two-edged sword.
Brexit analysis:
- With U.K. Prime Minister Boris Johnson now installed, Brexit scenarios have become even more convoluted. Our take on the various options ahead can be found in the following graphic.
-
Convoluted Brexit scenarios
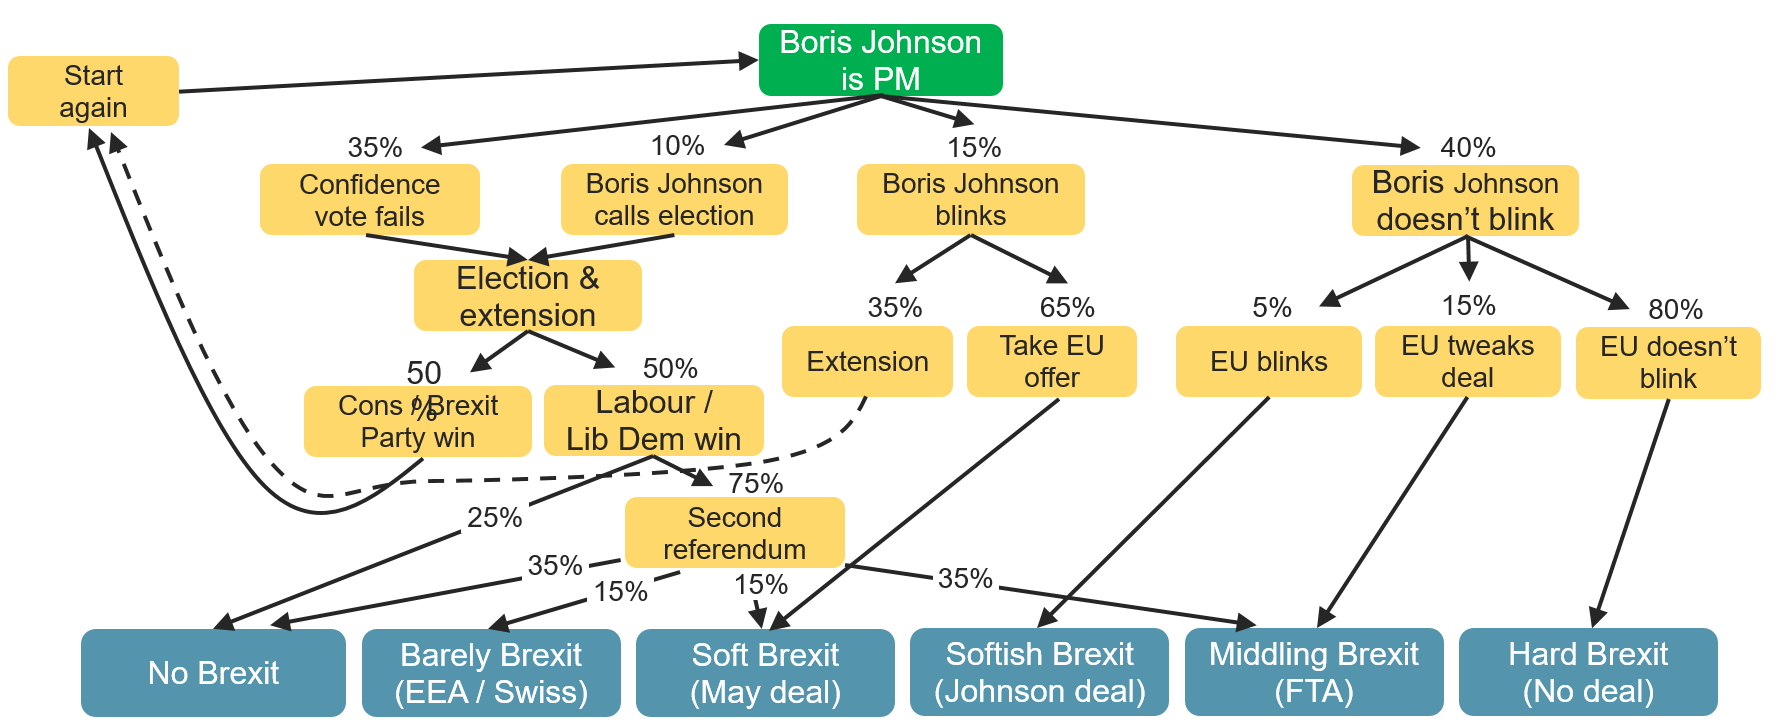
Source: RBC GAM
- While highly stylistic and with debatable assumptions, the flowchart is useful in a number of senses.
- Perhaps most importantly, it reveals the absurd number of ways that Brexit could still go. And yet the flowchart is simultaneously something of a simplification. It fails to factor in some of the more esoteric options, such as:
- a prorogued parliament
- a referendum without an election
- the reality that a hypothetical Conservative election win would reset the options with somewhat different probabilities than currently apply.
- Points of particular uncertainty relate to whether Boris Johnson will ultimately blink in his hardline strategy negotiations with the EU, whether a small handful of Conservative Party members would be willing to take down their own government in a confidence vote and how a government would be formed after an election given four parties all clustered between 19% and 23% support.
- Turning back to what is contained within the flowchart rather than what is missing from it, our thought exercise reveals some interesting conclusions. The most likely single scenario is now a hard, no deal Brexit. This is not good from a U.K. economic standpoint. All the same, at a 44% probability, that means something less damaging is technically more likely to transpire. What, exactly, is nearly anyone’s guess. Fewer than three months now remain until the October 31 deadline.
Negative yields:
- Bond yields are now extremely low due to recent risk aversion and dovish central banks, paired with a long-standing shortage of safe assets and an ongoing search for yield.
- The fraction of global debt trading at a negative interest rate has again soared, reaching a record high of $15 trillion, or 27% of all bonds.
-
Bonds with negative yields
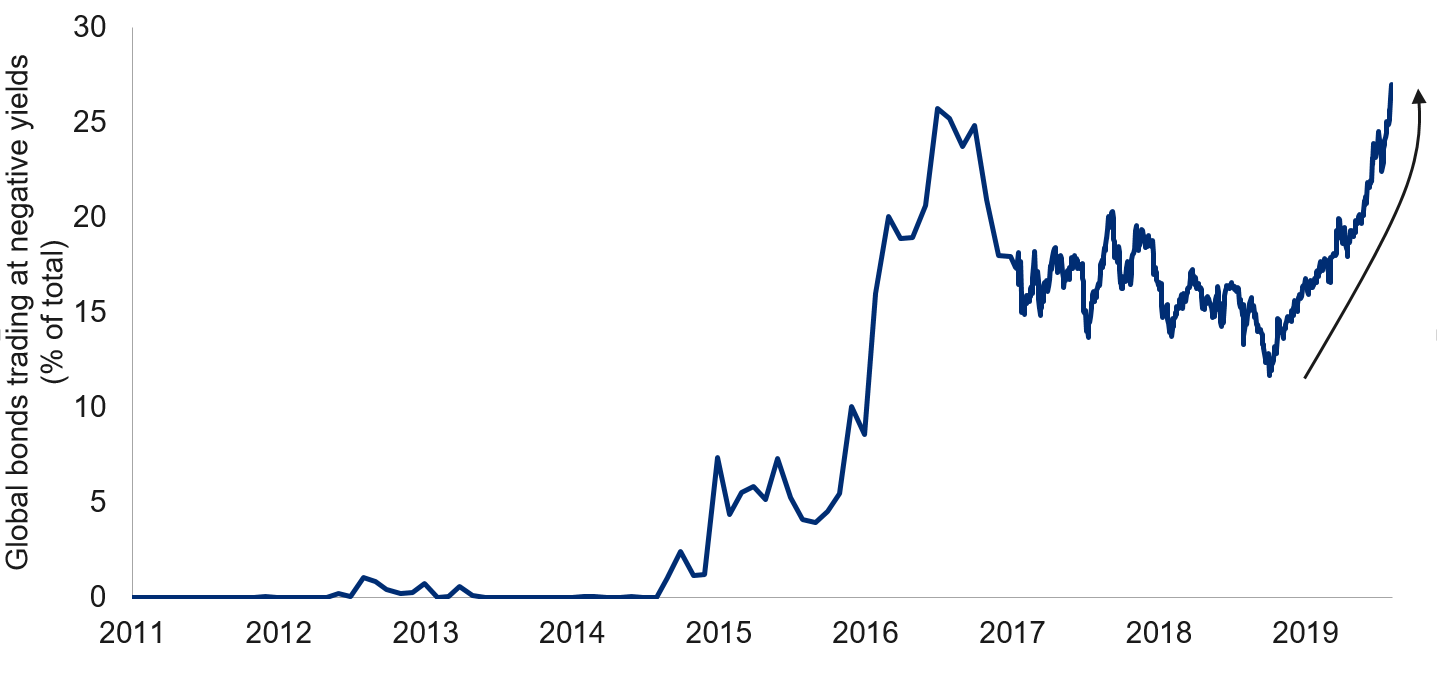
Note: As of 8/6/2019. Percentage of bonds in Bloomberg Barclays Global Aggregate Bond Index trading at negative yields. Source: Bloomberg, RBC GAM
- Who would buy bonds that charge the holder money to relinquish control of their own funds for a set period of time?
- Some tactical investors expect bond yields to fall further, and so to profit from the appreciation of the bond’s price to an extent that outweighs the steady drag of a negative coupon.
- Some investors are able to convert a negatively-yielding bond in a foreign market into a positive return in domestic terms by hedging out the currency risk under certain conditions. One’s home market must have the higher short-term interest rate of the two, and the foreign market must have the steeper yield curve of the two. These conditions are presently fulfilled for North American investors buying negatively-yielding European bonds, meaning that a positive return on these products is still achievable.
- Not all investors are sensitive to the expected return of a bond. The European Central Bank has purchased many European sovereign bonds with the intent of helping to depress interest rates as opposed to profit from them, and is unlikely to sell given the economic environment. Commercial banks are generally obliged to keep much of their capital in safe and liquid investments like government bonds; if the return on these bonds is negative, it is unfortunate but can’t be helped. Foreign reserve managers are similarly obliged to hold safe, liquid and usually short-term debt of foreign nations with an eye toward managing their exchange rate, not achieving a positive return.
- Other investors are sensitive to their expected return, but cannot adjust quickly or at all. As an example, an institutional investor might be mandated to hold only AAA European securities in their portfolio. They cannot buy something else unless their mandate changes – an involved process. Similarly, a pension fund may be unwilling to tolerate the risk necessary to buy higher-yielding bonds, and so they are stuck with a negative return.
- Why wouldn’t investors grappling with the prospect of a negative return simply keep their money in cash, or put it in a chequing account? Because those are not risk-free propositions, unlike a sovereign bond. Cash can be lost, destroyed or stolen. A chequing account is generally quite safe and provides deposit insurance. However, this may not be sufficient for a European corporation with far more money than deposit insurance can cover and given the degree of flux in the European banking sector over the past eleven years.
- This isn’t to say that negative yields are sustainable indefinitely. We have our doubts. But there are many reasons why it is at least sustainable over the short and medium run.
Data run:
- Canadian employment arrived somewhat soft, down 24K after a 2K loss in the prior month. The unemployment rate accordingly rose from 5.5% to 5.7%, embodying our prediction that the Canadian job market would soften over the remainder of 2019. Fortunately, the economic data – which had long lagged the labour market – has itself stabilized in recent months, suggesting no great disaster is in store.
- Italy’s coalition appears to be fracturing, with an election now likely. The junior party in the coalition – The League – is both the instigator and the likely beneficiary. Superficially, the story wouldn’t change much as populists should remain charge, but the party might be able to implement its policies more freely.